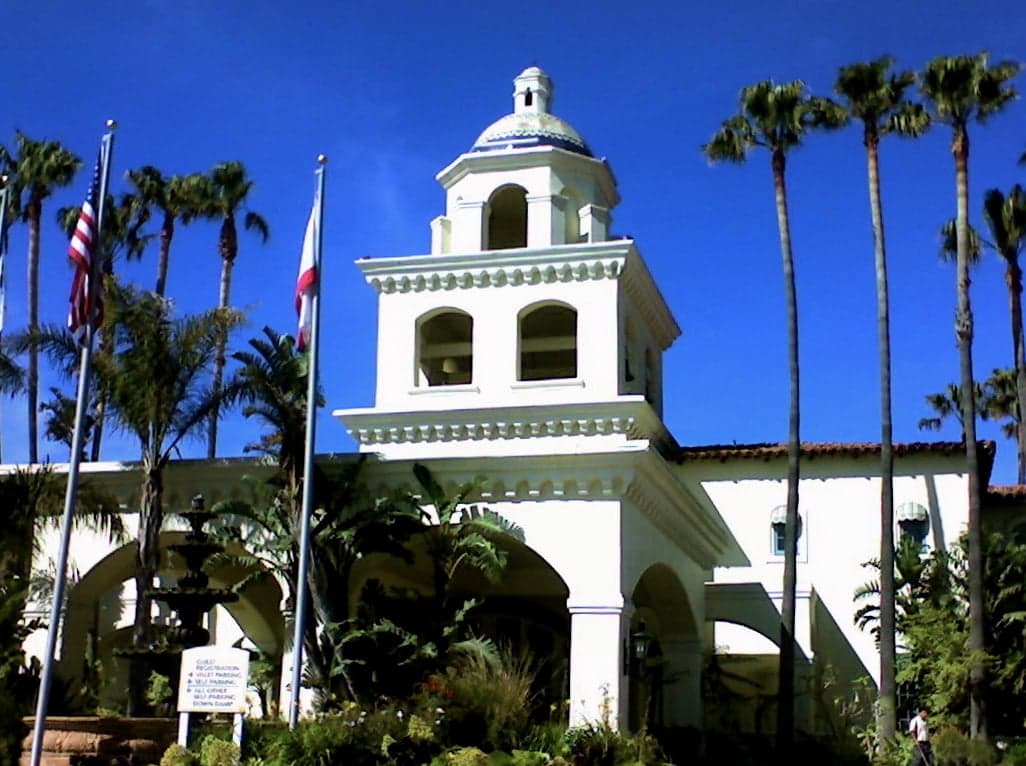
Photo: Wikipedia
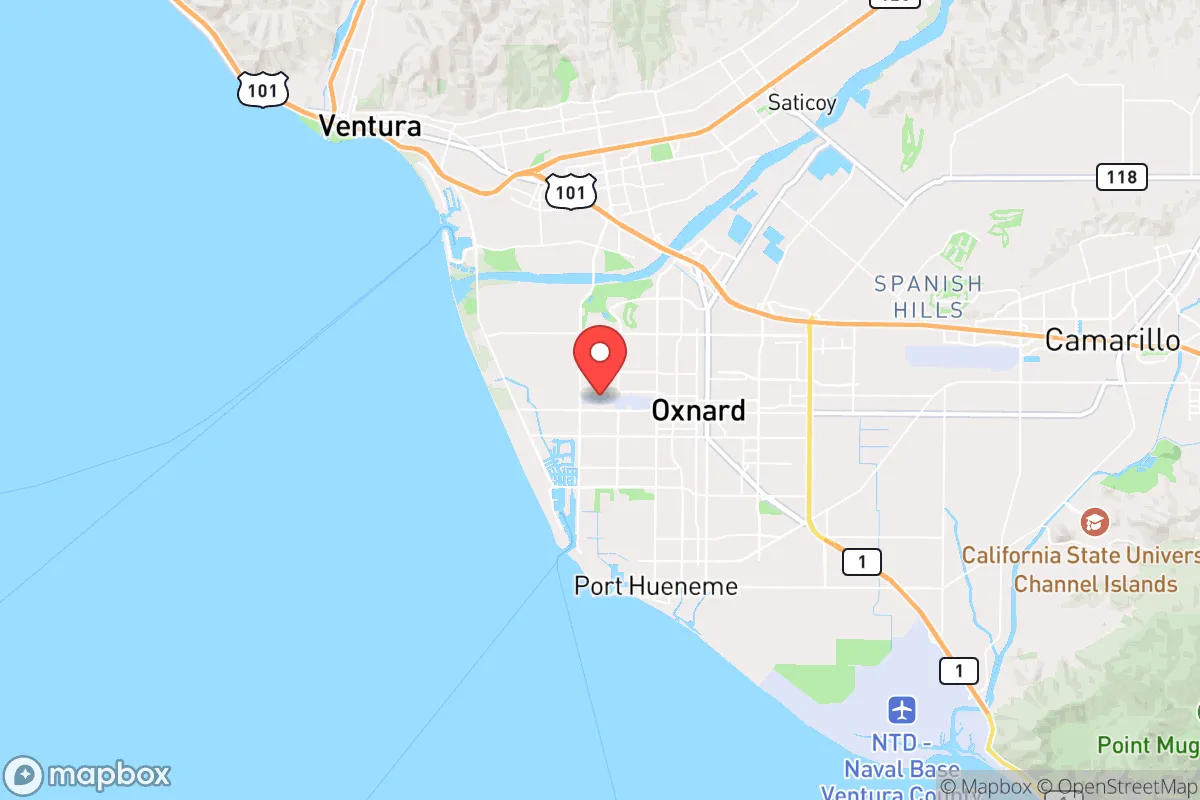
Quality of Life in Oxnard, CA
A high quality of life with strong walkability, manageable living costs, healthy neighborhood signals, and solid amenity access.
What does Quality of Life tell us?
Quality of Life blends cost of living, nearby amenities, socioeconomic signals, and neighborhood character. City-level scores represent the whole municipality; individual neighborhoods can differ.
What does this tell us?
Quality of Life blends cost of living, nearby amenities, socioeconomic signals, and neighborhood character. City-level scores represent the whole municipality; individual neighborhoods can differ.
Cost of Living
89% above national average
The Real Cost of Living in Oxnard, CA for 2026
| Tier | Individual | Family (4) |
|---|---|---|
| Survival | $31k | $59k |
| Comfortable | $91k | $133k |
| Luxury | $133k+ | $206k+ |
| Elite (Top 5%) | $156k+ | $242k+ |
70%
The Area Signal
A metric tracking the socioeconomic signals of the area.
Hobbies
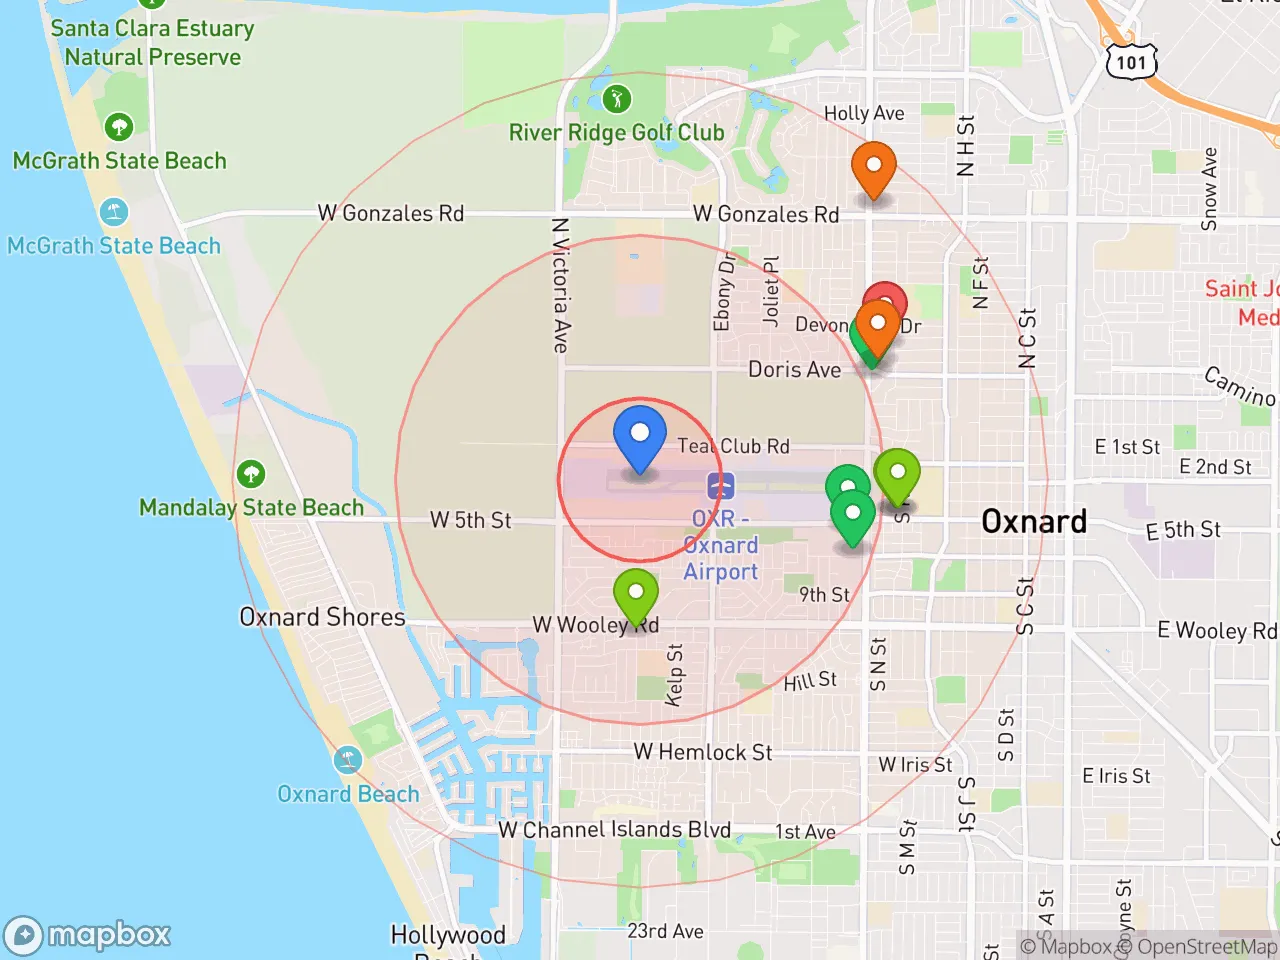
Explore the areaGroceries
6 within 10 miles
Gas
20 within 10 miles
Hospital
11 within 20 miles
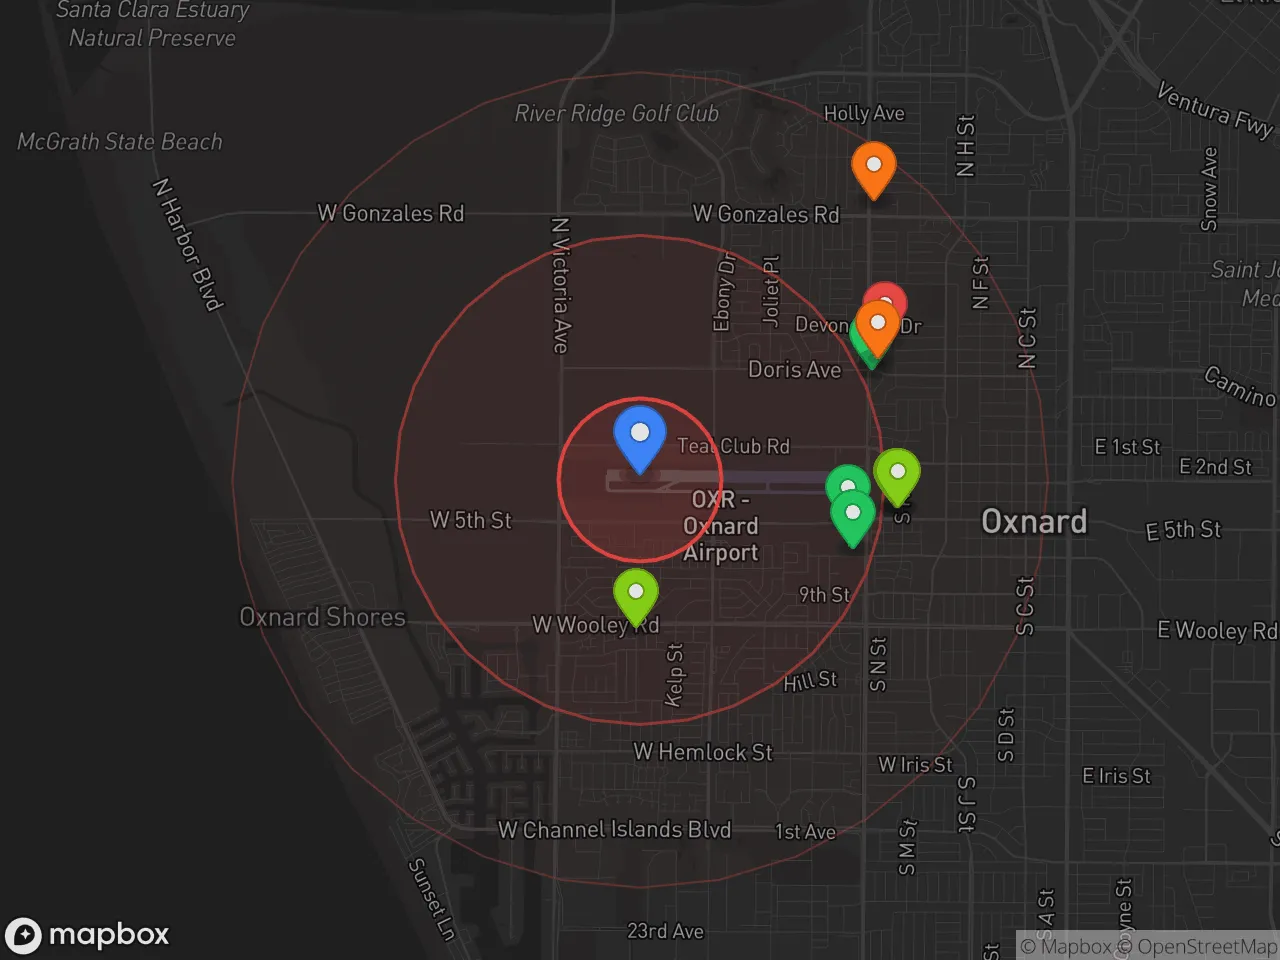
Airport
LAX — Los Angeles International
Post Office
USPS — Oxnard, CA
Critical Amenities
Quality-of-Life Analysis
Oxnard, California, presents a quality-of-life profile defined by its coastal location and a cost of living that significantly exceeds national averages, attracting a mix of long-established families, agricultural workers, and professionals priced out of more expensive coastal enclaves like Santa Barbara and Malibu. With a cost of living index of 189 (89% above the U.S. average), the city sits at a distinct affordability disadvantage compared to inland Ventura County communities, yet remains a relative bargain for those seeking direct Pacific Ocean access within commuting distance of Los Angeles. The population is notably diverse, with a large Latino majority and a growing number of remote workers and military-affiliated residents tied to Naval Base Ventura County, creating a community that balances blue-collar roots with a rising professional class.
Cost of living, housing affordability, and how Oxnard compares to nearby cities
Oxnard’s housing market is the primary driver of its high cost of living, though it remains more attainable than in neighboring Ventura or Santa Barbara. The median home value sits at $617,800, which is roughly $100,000 less than the median in Ventura city and nearly half the median in Santa Barbara. Monthly rents average $1,962, a figure that strains household budgets given that the median household income in Oxnard hovers around $75,000. For context, a household earning the median income would need to spend roughly 31% of gross pay on rent—within the federal affordability threshold, but leaving little room for savings. Compared to inland options like Camarillo or Thousand Oaks, Oxnard offers lower home prices but higher property taxes relative to value, and the trade-off is a longer average commute of 25.1 minutes, which is slightly above the national average but far shorter than the 45-minute-plus commutes common in Los Angeles County. Renters face a tight market with a vacancy rate below 4%, pushing many buyers toward fixer-uppers in neighborhoods like South Oxnard or the Channel Islands Harbor area.
What daily life is like for families: schools, amenities, and local rhythm
Daily life in Oxnard revolves around its beaches, agricultural heritage, and a growing food scene, though residents often note the city lacks the polished downtown of Ventura or the suburban uniformity of Camarillo. The Oxnard Union High School District serves over 17,000 students, with schools like Pacifica High School and Oxnard High School offering International Baccalaureate programs, though overall academic performance trails state averages—a key consideration for families weighing school quality. For recreation, the city boasts over 20 miles of coastline, including Mandalay State Beach and Silver Strand Beach, which are less crowded than those in Malibu. The Channel Islands Harbor provides a hub for kayaking, whale watching, and dining, while the Heritage Square district hosts seasonal events like the California Strawberry Festival. Commuting patterns are mixed: roughly 60% of workers drive alone, and the Ventura County Line Metrolink station offers a rail option to downtown Los Angeles in about 90 minutes, though service frequency is limited. Residents frequently cite the agricultural smell from nearby fields and occasional traffic congestion on Highway 101 as minor drawbacks, while the strong sense of community in neighborhoods like El Rio and the presence of the Naval Base lend a stable, family-oriented feel.
Oxnard is best suited for those who prioritize coastal living and space over urban nightlife or top-tier public schools, particularly families and professionals who can absorb the high housing costs through dual incomes or remote-work salaries. The city works well for military personnel stationed at Point Mugu or Port Hueneme, as well as for agricultural workers in the strawberry and avocado industries who find employment within the Oxnard Plain. It is less ideal for singles seeking a vibrant walkable downtown or for families who demand high-performing school districts without private-school tuition. For those willing to trade some urban polish for ocean access and a slower pace, Oxnard offers a grounded, sun-soaked quality of life that remains one of the more affordable options on California’s central coast.
Crime in Oxnard, CA
WARNING: The crime statistics are unreliable for this jurisdiction. Local authorities have either not reported or under reported their data to the FBI. This could be due to bad intentions, incompetence or technical issues. Regardless, we suggest skepticism.
Higher crime rates than 69% of comparable U.S. locations.
Violent CrimeViolent Crime Analysis
Property CrimeProperty Crime Analysis
Crime Analysis
Oxnard, California, presents a challenging safety landscape, with both violent and property crime rates significantly exceeding national averages. The city's violent crime rate stands at 553.7 incidents per 100,000 residents, while property crime occurs at a rate of 1,627.1 per 100,000. These figures place Oxnard in a higher-risk category compared to many similarly sized cities, a situation compounded by the broader criminal justice environment in Ventura County and the state of California.
Crime in context
Oxnard's violent crime rate is roughly 50% higher than the national average and well above the median for California cities of its size. The property crime rate, while less extreme relative to the national average, still represents a tangible risk for residents. These statistics reflect a broader trend seen across many large metro areas in California, where progressive criminal justice policies—including reduced sentencing for certain offenses, early release programs, and low bail requirements—have been linked to higher recidivism and a greater number of offenders on the street. The influence of liberal district attorneys and judges in the region contributes to an environment where the justice system is perceived by many as prioritizing offender rehabilitation over public safety and victim restitution.
What residents experience
For those living in Oxnard, the elevated crime rates translate into daily concerns about personal safety and property security. The most common violent crimes include aggravated assault and robbery, often connected to gang activity that has historically been a challenge for the city. Property crimes, particularly vehicle theft and burglary, are frequent, with many residents investing in security systems, steering wheel locks, and neighborhood watch participation. The presence of a progressive district attorney in Ventura County has led to policies that some critics argue reduce accountability for repeat offenders, fostering a sense among residents that the legal system does not adequately deter criminal behavior. This dynamic can erode trust in law enforcement and the courts, as victims may feel their experiences are minimized in favor of offender-focused reforms.
Neighborhood-level variation
Safety in Oxnard is not uniform across the city. The south and central areas, including neighborhoods near the downtown corridor and parts of the Oxnard Shores, tend to report higher concentrations of property crime and gang-related incidents. In contrast, north Oxnard and the RiverPark master-planned community generally experience lower crime rates, with more active homeowners' associations and private security patrols. The Channel Islands Harbor area offers a relatively safer environment, though it is not immune to vehicle break-ins. Prospective residents should research specific block-level data and consider that even in "safer" neighborhoods, the city's overall crime climate and the lenient justice system create a baseline risk that is higher than in many other parts of the country.
* Values derived from national, state, county, city and local statistics and may differ in a specific area. Last updated: 2026-04-29T18:50:17.000Z
Narrative content on this page is AI-generated and may contain mistakes. Verify any details that matter before acting on them.
ReloMaps may earn a commission from affiliate links at no extra cost to you.