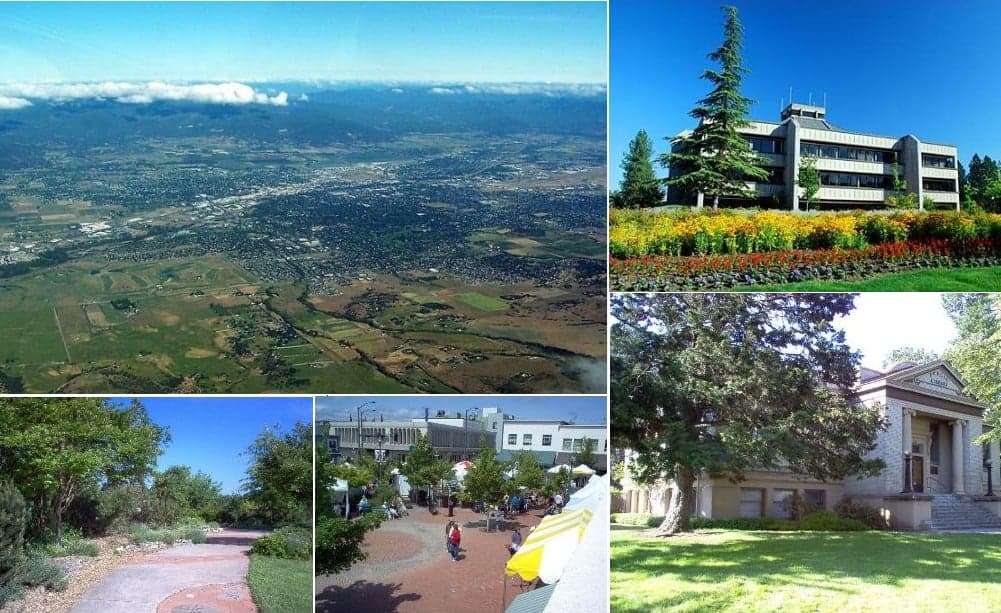
Photo: Wikipedia
Demographics of Medford, OR
Affluence Level in Medford, OR
A middle-class area roughly in line with national averages across income, home values, education, and employment.
People of Medford, OR
The people of Medford, Oregon today number 85,794, forming a predominantly white (74.7%) and increasingly Hispanic (16.4%) community with a notably low foreign-born share of just 3.2%. The city’s character is shaped by its role as the Rogue Valley’s commercial hub—more working-class and family-oriented than its artsy neighbor Ashland—with a population density of roughly 2,800 people per square mile. Distinctive markers include a strong sense of local independence, a growing Latino presence in the central and southern neighborhoods, and a population that is less college-educated (29.5%) than Oregon’s statewide average, reflecting its roots in agriculture, healthcare, and logistics.
How the city was settled and grew
Medford was founded in 1883 as a railroad town, named after the Oregon & California Railroad’s surveyor, David Loring, who hailed from Medford, Massachusetts. The original population was drawn by the promise of fertile land and rail access, with the first wave consisting of white settlers from the Midwest and Upper South—many of them farmers and merchants seeking opportunity in the Rogue Valley’s apple and pear orchards. The city’s early growth was anchored by the Jackson Street commercial corridor and the surrounding Historic East Side neighborhood, where many of these early families built modest homes. By the 1910s, a small but significant community of Japanese immigrants arrived to work in the orchards and railroad maintenance, settling primarily in the Oakdale area near the rail yards. The 1920s and 1930s brought a wave of Dust Bowl migrants from Oklahoma and Arkansas, who found work in the valley’s expanding timber and fruit-packing industries, concentrating in the West Medford neighborhood—a working-class area that remains a hub for multi-generational families. Through the mid-20th century, Medford’s population remained overwhelmingly white and native-born, with the foreign-born share hovering around 2-3% until the 1970s.
Modern era (post-1965)
The post-1965 era brought two major demographic shifts. First, the 1970s and 1980s saw a steady influx of Hispanic immigrants—primarily from Mexico—drawn by year-round agricultural work in the Rogue Valley’s pear, apple, and wine grape industries. These families settled heavily in South Medford (south of Barnett Road) and the Fruitdale area, where older housing stock and proximity to packing sheds made for affordable entry points. Today, the Hispanic population stands at 16.4%, making it the largest minority group, and these neighborhoods remain the cultural heart of Medford’s Latino community, with Spanish-language churches, markets, and festivals concentrated along Riverside Avenue. Second, the 1990s and 2000s brought domestic in-migration from California—retirees, remote workers, and families seeking lower housing costs—who settled in newer subdivisions on the city’s northern and eastern edges, such as North Medford and the East Medford area near the Rogue Valley Mall. This wave was overwhelmingly white and middle-class, reinforcing the city’s overall racial composition. The East/Southeast Asian population remains small at 1.2%, with a modest cluster of Vietnamese and Filipino families in the Central Medford corridor, while the Indian-subcontinent population is negligible at 0.1%. The Black population (0.9%) is similarly small, with no single neighborhood concentration. Medford’s foreign-born share (3.2%) is well below the national average, reflecting the city’s limited draw for international immigration outside of the Hispanic agricultural stream.
The future
Medford’s population is slowly becoming more diverse, driven primarily by natural increase among the Hispanic community and continued domestic in-migration from California and the Pacific Northwest. The Hispanic share is projected to rise toward 20-22% by 2040, with growth concentrated in South Medford and Fruitdale, where younger families are expanding into adjacent unincorporated areas like Phoenix and Talent. The white population is aging and declining slightly in share, while the East/Southeast Asian and Black populations are expected to remain small but stable, with no major new immigration corridors emerging. The city’s cultural identity is evolving from a historically white, agricultural-rooted community into a more bilingual, bicultural one—evident in the growing number of Spanish-language services, dual-immersion programs in Medford School District, and Latino-owned businesses along Main Street. The next 10-20 years will likely see continued suburban-style growth on the northern and eastern fringes, while the central and southern neighborhoods become more densely populated and ethnically mixed. For someone moving in now, Medford offers a community that is still predominantly white and conservative-leaning, but with a visible and growing Hispanic presence that is reshaping the city’s everyday life—from food to festivals to local politics.
Bottom-line: Medford is becoming a more diverse, family-oriented hub in the Rogue Valley, but its demographic change is gradual and largely driven by Hispanic growth rather than broad international immigration. New arrivals will find a city that values its agricultural and railroad heritage while adapting to a more bilingual future, with distinct neighborhoods—from the historic East Side to the growing South Medford corridor—offering different entry points into the community.

* Values derived from national, state, county, city and local statistics and may differ in a specific area. Last updated: 2026-06-14T13:55:25.000Z
Narrative content on this page is AI-generated and may contain mistakes. Verify any details that matter before acting on them.
ReloMaps may earn a commission from affiliate links at no extra cost to you.

