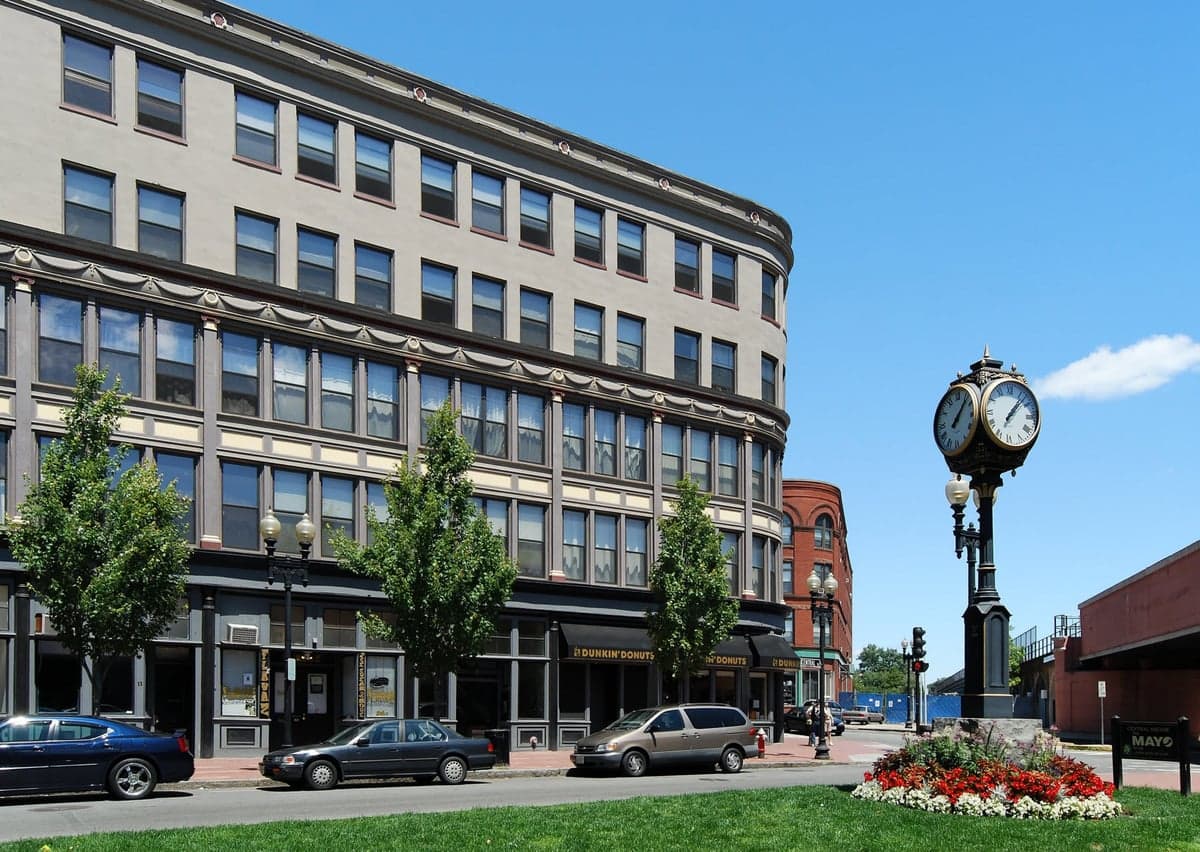
Photo: Wikipedia
Quality of Life in Essex County
A livable area that tracks near national norms for affordability, walkability, and neighborhood health.
What does Quality of Life tell us?
Quality of Life measures an area by evaluating factors like cost of living, nearby amenities, country club access, airport proximity, socioeconomic signals and neighborhood character. For large states, this is a general average — quality of life can vary dramatically between metro areas, suburbs, and rural communities within the same state.
What does this tell us?
Quality of Life measures an area by evaluating factors like cost of living, nearby amenities, country club access, airport proximity, socioeconomic signals and neighborhood character. For large states, this is a general average — quality of life can vary dramatically between metro areas, suburbs, and rural communities within the same state.
Cost of Living
69% above national average
60%
The Real Cost of Living in Essex County for 2026
| Tier | Individual | Family (4) |
|---|---|---|
| Survival | $27k | $50k |
| Comfortable | $113k | $167k |
| Luxury | $180k+ | $278k+ |
| Elite (Top 5%) | $223k+ | $346k+ |
Quality-of-Life Analysis
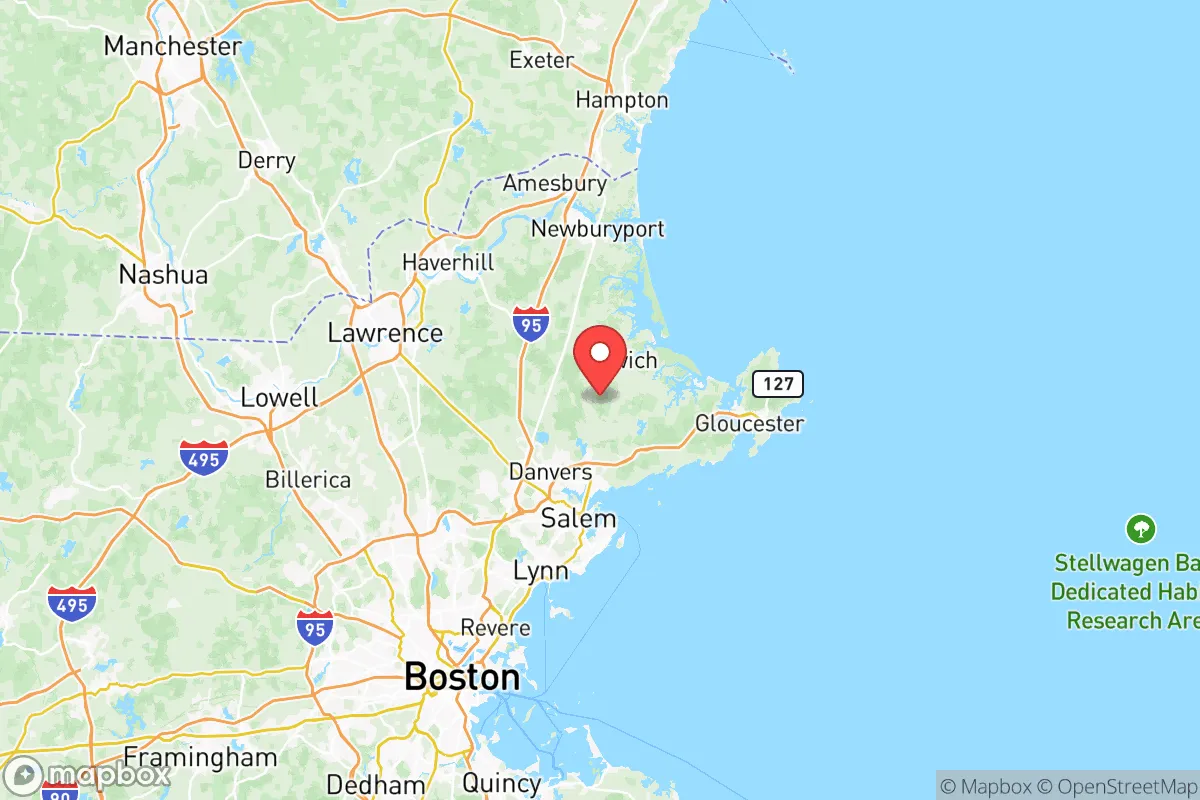
Essex County, Massachusetts, offers one of the most diverse quality-of-life spectrums in New England, drawing everyone from Boston commuters and maritime professionals to rural homesteaders and creative-class entrepreneurs. The county’s character shifts dramatically from the dense, historic port cities of the coast to the wooded hill towns and working farms of its interior, creating distinct lifestyle zones within a single 30-minute commute radius.
Largest town(s) & population centers
The county’s population anchor is Lynn (pop. ~101,000), a dense, diverse urban center with a revitalizing downtown and direct MBTA commuter rail access to Boston in under 30 minutes. Daily life here is walkable and transit-oriented, centered around Lynn Commons, the waterfront Lynn Shore Drive, and a growing food scene. Salem (pop. ~44,000) blends a world-famous tourism economy with a year-round residential community; its compact, historic core is packed with restaurants, museums, and the Salem State University campus, while its North River neighborhood offers quieter, family-oriented streets. Peabody (pop. ~54,000) and Beverly (pop. ~42,000) function as suburban-commercial hubs: Peabody is anchored by the Northshore Mall and major retail corridors, while Beverly combines a walkable downtown with a strong public school system and a commuter rail stop. Lawrence (pop. ~89,000), the Merrimack Valley’s largest city, is a gateway for immigrant communities and offers the county’s most affordable housing stock, with a median home value roughly 20% below the county average, though its schools and public services face persistent funding challenges.
Smaller towns & rural pockets
Beyond the population centers, Essex County contains genuine rural enclaves that feel disconnected from the coastal sprawl. Georgetown, in the county’s northwest corner, is a classic New England small town with a single stoplight, a working agricultural base, and a median home value near $650,000 that reflects its desirability among families seeking land and low crime rates. Boxford, straddling the Middlesex County line, is almost entirely residential with large wooded lots, no downtown commercial district, and some of the county’s highest-performing public schools. Wenham and Manchester-by-the-Sea are small coastal towns (pop. under 5,000 each) where daily life revolves around village centers, town beaches, and conservation land; Manchester’s Singing Beach and Wenham’s Gordon College anchor their respective communities. The Merrimack River valley between Haverhill and Newburyport contains scattered rural pockets like West Newbury, where horse farms and apple orchards coexist with new subdivisions, and Rowley, a town of 6,000 that retains a working cranberry-bog landscape alongside its commuter rail station.
Cost & lifestyle range
The county’s overall cost-of-living index of 169 (nearly 70% above the U.S. average) masks extreme internal variation. At the high end, Newburyport and Marblehead command median home values above $800,000, with Newburyport’s walkable downtown, waterfront parks, and top-ranked schools creating a premium lifestyle that attracts professionals and empty-nesters willing to pay for a “small city” experience. Rockport and Gloucester offer a slightly lower entry point (median home values around $550,000–$600,000) but trade urban amenities for dramatic coastal scenery, working fishing harbors, and a slower pace. At the affordable end, Lawrence and Haverhill have median home values near $400,000–$450,000, with rents averaging $1,400–$1,600 for a two-bedroom — still high by national standards but the cheapest options within commuting distance of Boston. The county’s average commute of 28.9 minutes is manageable, but residents in the rural northwest (Georgetown, Boxford) often face 35–45 minute drives to I-95 employment centers, while coastal commuters can reach downtown Boston in 30–40 minutes via the Newburyport/Rockport commuter rail line.
Essex County works best for people who want a clear trade-off between density and space. Urbanists and transit-dependent residents thrive in Lynn, Salem, and Lawrence; families seeking top schools and land gravitate toward Boxford, Georgetown, and Manchester-by-the-Sea; and those who want coastal character without Boston prices find a niche in Gloucester, Rockport, or the Merrimack River towns. The county’s real strength is that a single region can offer a working waterfront, a commuter suburb, and a rural farm town within a 20-mile radius — a range of options that few other Massachusetts counties can match.
Crime in Essex County
Generally safer than 71% of comparable U.S. locations.
Violent CrimeViolent Crime Analysis
Property CrimeProperty Crime Analysis
Crime Analysis
Essex County, Massachusetts, presents a mixed safety landscape where violent crime rates remain well below national averages, but property crime and localized hotspots demand attention from prospective residents. With a violent crime rate of 235.8 per 100,000 residents and a property crime rate of 813.5 per 100,000, the county’s overall safety profile is shaped by stark contrasts between affluent coastal communities and older industrial cities. Understanding where these crimes cluster—and how local prosecutorial policies influence outcomes—is essential for anyone evaluating relocation to this northeastern Massachusetts region.
Crime in context
Essex County’s violent crime rate of 235.8 per 100,000 sits roughly 37% below the national average of 380 per 100,000, but it runs slightly above the Massachusetts state average of 210 per 100,000. Property crime at 813.5 per 100,000 is nearly 40% lower than the U.S. median of 1,342 per 100,000, yet it exceeds the state average of 750 per 100,000. These figures place Essex County in a middle tier among Massachusetts counties—safer than Suffolk County (Boston) but more crime-prone than suburban Middlesex County. The county’s crime index is heavily influenced by its larger cities: Lawrence, Lynn, and Salem consistently report higher violent and property crime rates, while towns like Andover, Boxford, and Manchester-by-the-Sea record rates near the lowest in the state. The presence of progressive district attorneys in Essex County—particularly in the Eastern District covering Lawrence and Lynn—has drawn criticism from law enforcement advocates who argue that lenient charging policies and reduced pretrial detention contribute to repeat offending and undermine public confidence in the justice system.
What residents experience
Daily life in Essex County varies dramatically by municipality. In Lawrence, the county’s most challenged city, residents face a violent crime rate exceeding 400 per 100,000—nearly double the county average—driven by gang-related activity and drug trafficking along the Merrimack River corridor. Lynn reports similar struggles, with property crime rates above 1,200 per 100,000, including frequent vehicle break-ins and package thefts. Conversely, Newburyport and Ipswich enjoy violent crime rates below 100 per 100,000, where residents commonly leave doors unlocked and children walk to school without concern. Property crime in these communities is largely limited to opportunistic theft from unlocked cars. The county’s Essex County District Attorney’s Office has implemented diversion programs for low-level offenders, which supporters say reduce recidivism but critics argue fail to hold repeat property criminals accountable. Residents in safer towns often express frustration that progressive policies in neighboring cities spill over as property criminals cross municipal borders.
Neighborhood-level variation and what to watch
Within individual cities, safety divides are sharp. In Salem, the historic downtown and waterfront areas near the Salem Common are generally safe, with violent crime concentrated in the Point neighborhood and along the Highland Avenue corridor. Beverly shows a similar pattern: the Ryal Side and North Beverly sections are among the safest in the county, while the downtown area near the commuter rail station sees elevated larceny and disorderly conduct complaints. Prospective residents should examine block-level crime maps rather than citywide averages, as a single street can separate a low-crime enclave from a high-incident zone. The Essex County Sheriff’s Department operates the Middleton Jail and provides regional law enforcement support, but local policing remains the primary deterrent. Communities with strong neighborhood watch programs and proactive police departments—such as Swampscott and Marblehead—consistently report the lowest crime rates in the county. For those prioritizing safety, focusing on towns with conservative or moderate local governance and traditional prosecutorial approaches offers the most predictable outcomes.
* Values derived from national, state, county, city and local statistics and may differ in a specific area. Last updated: 2026-05-12T05:22:43.000Z
Narrative content on this page is AI-generated and may contain mistakes. Verify any details that matter before acting on them.
ReloMaps may earn a commission from affiliate links at no extra cost to you.