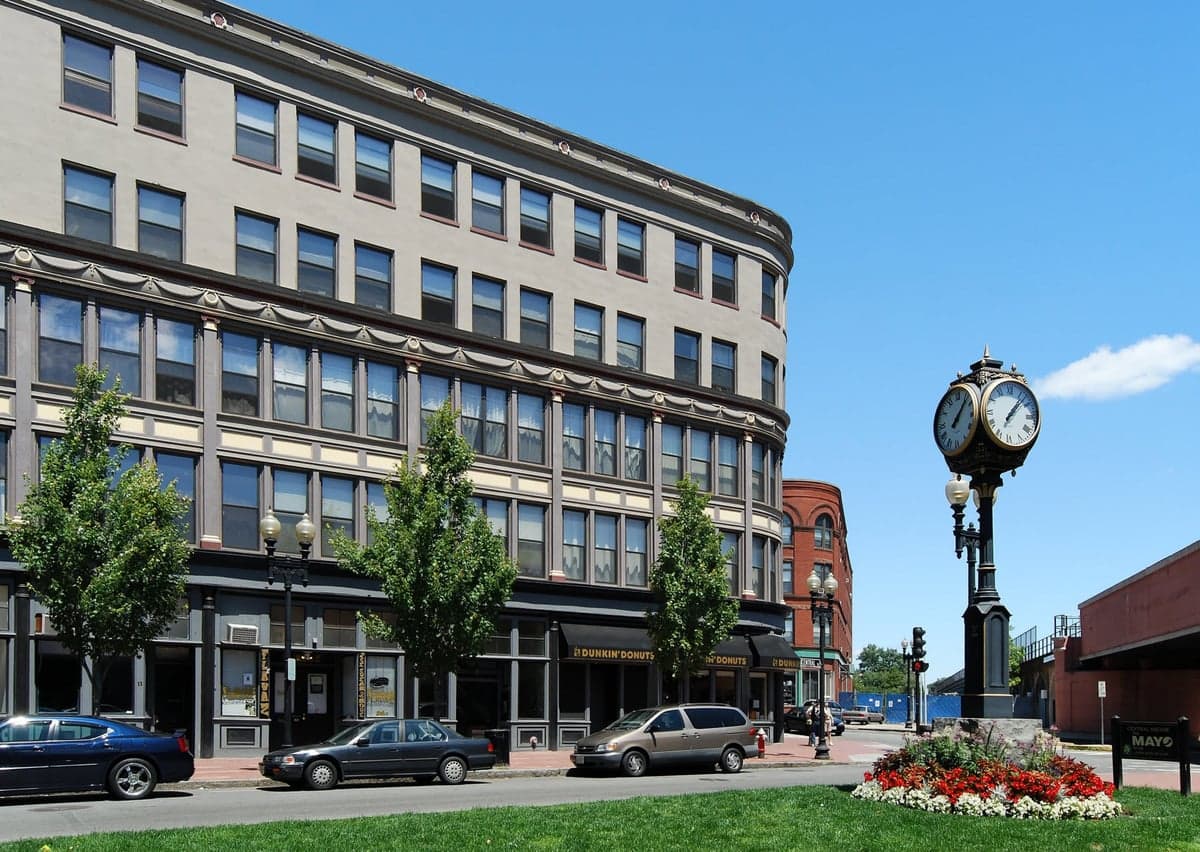
Photo: Wikipedia
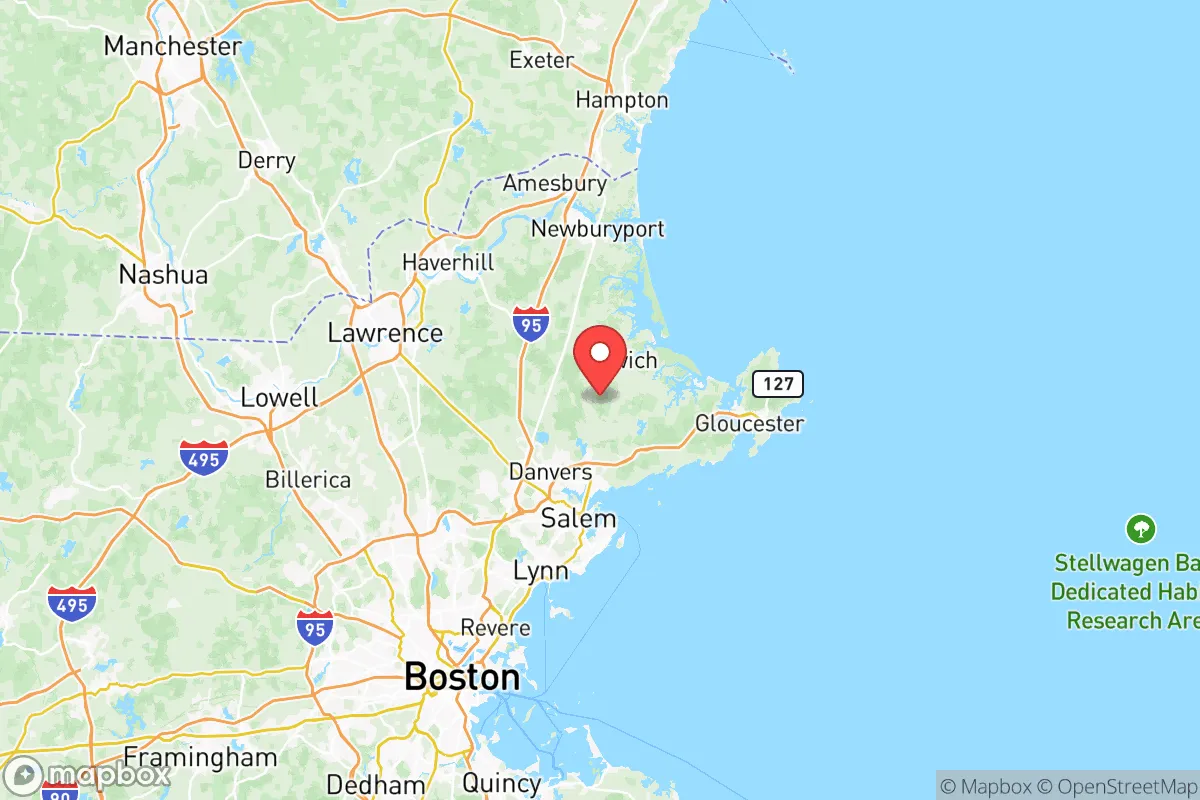
Demographics of Essex County
Affluence Level in Essex County
An upper-middle-class area. Household wealth, education levels, and homeownership run ahead of national benchmarks.
People of Essex County
The people of Essex County, Massachusetts today number 807,258, forming a densely populated region that blends historic Yankee stock with a substantial and growing Hispanic population, now at 23.2% of the county. The county remains majority white at 65.9%, but its character is increasingly defined by the contrast between older, established communities along the coast and newer, more diverse populations in inland cities. A relatively low foreign-born share of 8.2% and a high college-educated rate of 42.3% point to a population that is both rooted and well-educated, with a distinctive identity shaped by centuries of maritime trade, industrial immigration, and recent suburbanization.
Settlement & growth (pre-1960)
Before European contact, the area now known as Essex County was home to the Massachusett and Pawtucket peoples, Algonquian-speaking tribes who lived along the coast and rivers, fishing, farming, and trading. English Puritan colonists began arriving in the 1620s and 1630s, establishing the first permanent European settlements. Salem, founded in 1626, became a major port and the county's early seat of power, while Beverly, Lynn, and Gloucester grew as fishing and shipbuilding centers. These early settlers were overwhelmingly English, and their Congregationalist church culture shaped the region's political and social institutions for generations.
The 18th and 19th centuries brought diversification through maritime trade and early industrialization. Newburyport and Marblehead became wealthy from shipping and privateering, attracting merchants and skilled craftsmen. The Industrial Revolution transformed the county dramatically after 1800. Lawrence, founded in 1845 as a planned mill city, drew waves of Irish immigrants fleeing the Great Famine in the 1840s and 1850s to work in its textile mills. Lowell, though technically in Middlesex County, exerted a gravitational pull on Essex County's mill towns, and Haverhill and Amesbury saw similar Irish settlement. By 1860, the Irish were the largest foreign-born group in the county, concentrated in the mill districts of Lawrence and Lynn, where shoe manufacturing boomed.
The late 19th and early 20th centuries brought new waves. French Canadians from Quebec arrived in large numbers between 1870 and 1910, settling in Lawrence, Lowell, and Haverhill to work in the mills, forming tight-knit parishes and maintaining their language and culture well into the 20th century. Italians followed between 1880 and 1920, particularly in Lynn and Salem, where they worked in shoe factories and as fishermen. Eastern European Jews, fleeing pogroms in Russia and Poland, established communities in Lynn and Salem, contributing to the region's commercial and intellectual life. By 1920, Essex County was a mosaic of Yankee, Irish, French Canadian, Italian, and Jewish enclaves, each with its own churches, social clubs, and political loyalties.
The Great Depression and World War II slowed immigration, but the post-war boom brought suburban expansion. Andover, North Andover, and Middleton grew as bedroom communities for Boston commuters, attracting upwardly mobile descendants of earlier immigrant groups. The decline of the textile and shoe industries after 1950 pushed many mill-town residents into service and professional jobs, while the construction of Route 128 and Interstate 95 opened the county's interior to development.
Modern era (post-1965)
The 1965 Hart-Cellar Act fundamentally changed Essex County's demographics, though the effects were slower to appear here than in gateway cities like Boston or New York. The county's foreign-born share, at 8.2%, remains modest compared to the national average, but the composition of that population has shifted dramatically. The most significant change has been the growth of the Hispanic population, which now stands at 23.2%. This growth is concentrated in Lawrence, which is now over 80% Hispanic, primarily of Puerto Rican and Dominican origin. Salem and Lynn have also seen substantial Hispanic growth, with significant populations from Central America, particularly Guatemala and El Salvador.
East and Southeast Asian communities, at 2.4% of the county, are smaller but visible. Andover and Lexington (the latter just over the Middlesex line) have attracted Chinese and Taiwanese professionals working in the tech and biotech sectors along the Route 128 corridor. Indian subcontinent residents, at 1.0%, are a separate and growing group, concentrated in Andover and North Andover, where many work in engineering, healthcare, and information technology. The Black population, at 3.5%, is relatively small and dispersed, with notable communities in Lynn and Lawrence, including both African American families with deep roots and more recent immigrants from Haiti and Cape Verde.
Domestic migration has also reshaped the county. The decline of manufacturing in Lawrence and Haverhill has been offset by the growth of the knowledge economy along the I-95 and Route 128 corridors. Andover, Boxford, and Topsfield have attracted affluent professionals from Boston and Cambridge, driving up home prices and pushing out lower-income families. This has created a sharp economic divide between the coastal and inland towns, with Gloucester and Rockport retaining a more working-class, Yankee character, while Andover and North Andover have become increasingly diverse and affluent.
The future
Essex County is likely to continue its trajectory of slow but steady diversification, with the Hispanic population projected to grow from its current 23.2% toward 30% by 2040, driven by higher birth rates and continued immigration from Latin America. The white population, while still a majority at 65.9%, will continue to age and shrink in absolute numbers, particularly in the older coastal towns. The East and Southeast Asian and Indian populations are expected to grow modestly, as the Route 128 tech corridor attracts skilled immigrants, but they will remain small relative to the Hispanic cohort.
The county is not homogenizing but rather tribalizing into distinct enclaves. Lawrence will remain a predominantly Hispanic city, while Andover and North Andover will become increasingly multi-ethnic and professional. The coastal towns—Gloucester, Rockport, Marblehead—will likely stay whiter and older, as high housing costs and limited job growth deter younger and more diverse families. This geographic sorting could intensify political and cultural divisions, with the inland suburbs leaning more liberal and diverse, and the coastal towns remaining more conservative and homogeneous.
For someone moving into Essex County now, the choice of town matters enormously. A family settling in Andover will find a diverse, highly educated, and expensive community with excellent schools and a strong sense of civic engagement. A family moving to Lawrence will find a more affordable, heavily Hispanic city with challenges in schools and public safety, but also a vibrant cultural life and strong community networks. The county as a whole is becoming a place where demographic destiny is increasingly tied to zip code, and where the old Yankee-Irish-French Canadian mosaic is being replaced by a new one of Hispanic, Asian, and professional-class enclaves.
* Values derived from national, state, county, city and local statistics and may differ in a specific area. Last updated: 2026-05-12T05:22:43.000Z
Narrative content on this page is AI-generated and may contain mistakes. Verify any details that matter before acting on them.
ReloMaps may earn a commission from affiliate links at no extra cost to you.