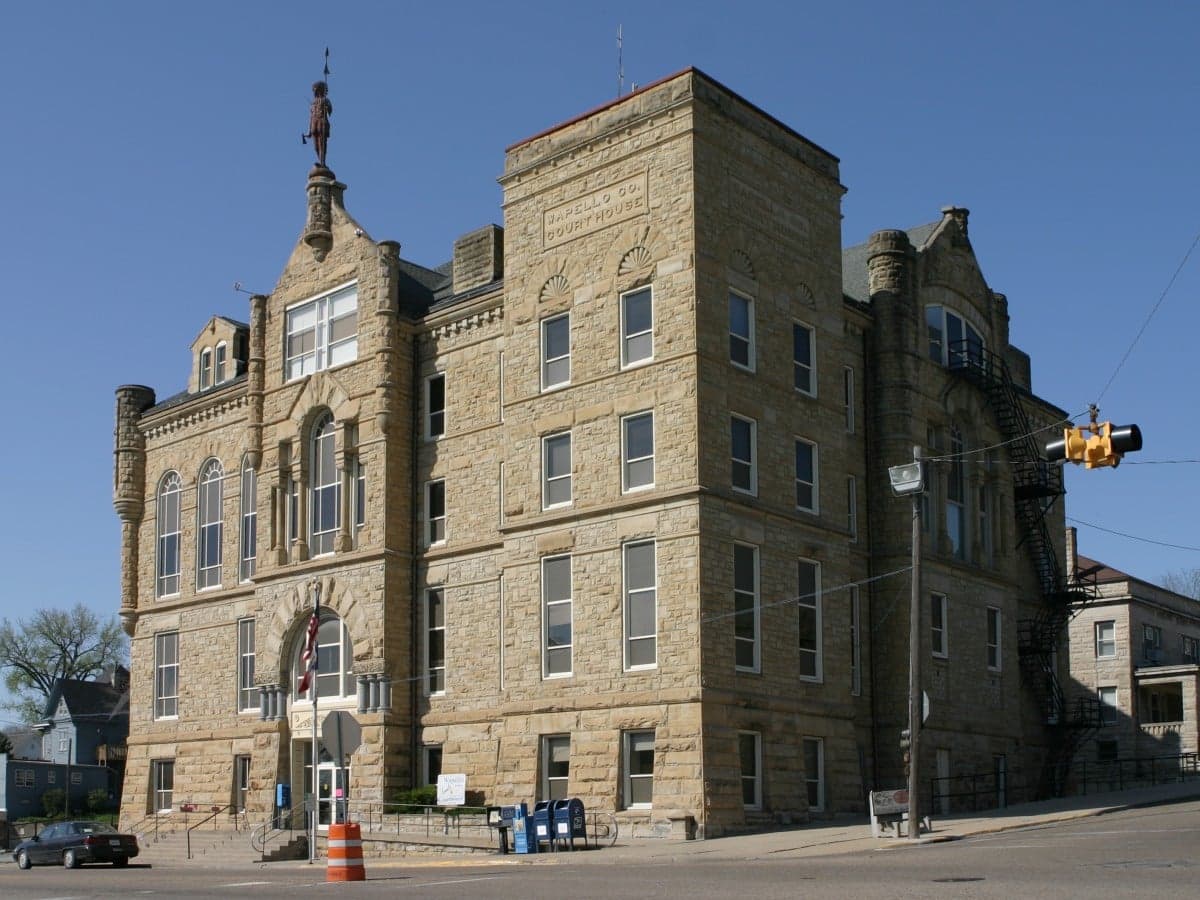
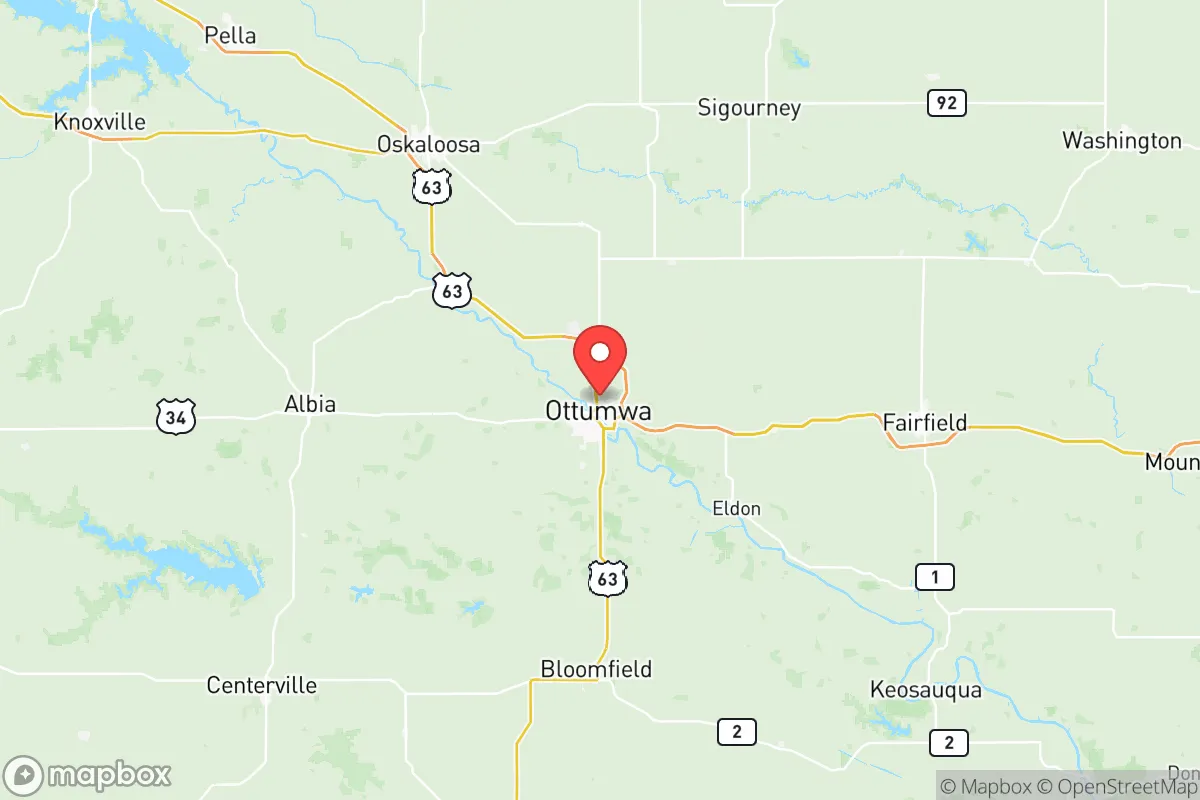
Photo: Wikipedia
Demographics of Wapello County
Affluence Level in Wapello County
A middle-class area roughly in line with national averages across income, home values, education, and employment.
People of Wapello County
Today, Wapello County, Iowa, is home to roughly 35,265 residents, a population shaped by successive waves of immigration and migration that have left a distinct, working-class character. The county is predominantly white (77.3%), with a significant and growing Hispanic community (12.6%) and smaller Black (3.1%) and East/Southeast Asian (1.2%) populations. Its identity is rooted in a history of agricultural labor, coal mining, and manufacturing, with a notably lower college attainment rate (19.4%) than the state average, reflecting a community that values practical skills and local industry. The people of Wapello County are concentrated in the county seat of Ottumwa, with smaller populations in towns like Agency, Eddyville, and Eldon, each bearing the marks of the groups that settled them.
Settlement & growth (pre-1960)
Before American settlement, the land that is now Wapello County was home to the Sauk and Meskwaki (Fox) peoples, who used the area for hunting and seasonal camps. The county itself is named after Chief Wapello of the Meskwaki, a testament to the region's Native heritage. The first permanent American settlers arrived in the 1830s and 1840s, primarily of Scots-Irish and English stock, drawn by the promise of fertile farmland in the Des Moines River valley. They established the earliest communities, including the original county seat of Agency (named for the federal Indian agency that operated there) and the river town of Ottumwa, which quickly became the commercial and industrial hub.
The most transformative wave of immigration came in the 1850s through the 1880s, when German and Irish immigrants poured into the county. Germans, in particular, were drawn by the availability of cheap land and the region's growing coal mining industry. They established strong farming communities in the rural areas around Blakesburg and Chillicothe, while also forming the backbone of Ottumwa's emerging industrial workforce. The Irish, arriving in large numbers during and after the Great Famine, found work building the railroads that connected Ottumwa to the national market and later in the coal mines that dotted the county's southern half. By 1900, Ottumwa was a booming railroad and coal town, with a population that had swelled to over 18,000, making it one of the largest cities in Iowa.
The early 20th century saw a smaller but significant influx of Italian and Eastern European immigrants, who settled primarily in Ottumwa's working-class neighborhoods near the packing plants and factories. These groups, along with the Germans and Irish, created a mosaic of ethnic Catholic parishes and fraternal organizations that defined the county's social life for decades. The coal mining industry, centered around towns like Kirkville and Eddyville, attracted a diverse workforce, including a small number of Black miners who migrated from the South during the World War I era. The Great Depression and the subsequent decline of coal mining in the 1940s and 1950s slowed population growth, but the county's manufacturing base—anchored by John Deere's Ottumwa Works and a major meatpacking plant—kept the economy stable and the population relatively static through the 1960s.
Modern era (post-1965)
The 1965 Hart-Cellar Act, which abolished national-origin quotas, had a delayed but profound effect on Wapello County. The most significant demographic shift began in the 1990s and accelerated in the 2000s, driven by the meatpacking and food processing industries. Companies like Cargill and Hormel, which operated major facilities in Ottumwa, actively recruited immigrant labor to fill jobs that were increasingly difficult to staff with the local population. This brought a wave of Hispanic immigrants, primarily from Mexico and Central America, who settled in Ottumwa and, to a lesser extent, in Eldon and Eddyville. The Hispanic share of the county's population rose from under 2% in 1990 to over 12% by 2020, transforming the cultural and linguistic landscape of the county.
This same period saw a smaller but notable influx of East/Southeast Asian immigrants, including Vietnamese and Laotian families, who also found work in manufacturing and food processing. They established a small but visible community in Ottumwa, concentrated near the industrial corridors. The Black population, which had been a tiny minority since the early 20th century, grew modestly through domestic migration from Chicago and other Midwestern cities, drawn by lower housing costs and available factory work. Meanwhile, the county's white population, which had been in gradual decline since the 1960s due to outmigration of younger residents to larger cities, continued to age and shrink. The foreign-born share of the population now stands at 5.4%, a figure that is modest by national standards but represents a dramatic change for a county that was nearly 99% white as recently as 1980.
Suburbanization has been limited in Wapello County, as the population is too small to support extensive sprawl. However, Ottumwa has seen some growth in its outer edges, with new housing developments catering to families seeking larger lots and newer homes. The smaller towns—Agency, Blakesburg, and Chillicothe—have remained largely white and aging, while the rural areas continue to depopulate as family farms consolidate into larger operations.
The future
The population of Wapello County is projected to continue its slow decline, driven by an aging white population and the outmigration of young adults seeking higher education and white-collar jobs elsewhere. The county's college attainment rate of 19.4% is well below the national average, and the lack of a four-year university within the county limits (the nearest is in Fairfield, home to Maharishi International University) limits the ability to retain educated talent. However, the Hispanic population is younger and has higher birth rates, meaning the county will become more diverse over time. The Hispanic share could approach 20% by 2040, and this community is increasingly dispersed beyond Ottumwa into towns like Eldon and Eddyville, where they are revitalizing local schools and small businesses.
The East/Southeast Asian and Black populations are likely to remain small but stable, sustained by continued recruitment for manufacturing and food processing jobs. The Indian subcontinent population, currently a tiny 0.1%, is unlikely to grow significantly unless a major employer in healthcare or technology establishes a presence in the county. The county's cultural identity is evolving from a homogeneous, white, working-class community into a more pluralistic one, though this transition is not without friction. The next 10-20 years will likely see Wapello County become a more diverse, if smaller, place, with Ottumwa serving as the primary hub of multicultural life and the smaller towns remaining more homogeneous.
For someone moving in now, Wapello County offers a low cost of living, a strong sense of local history, and a community that is slowly but steadily becoming more diverse. The economic anchors remain manufacturing and agriculture, and the social fabric is being rewoven by the energy and ambition of immigrant families. It is a place where the past is visible in every small town and farmstead, but the future is being written in the new businesses, churches, and schools of a changing population.

* Values derived from national, state, county, city and local statistics and may differ in a specific area. Last updated: 2026-07-16T18:25:32.000Z
Narrative content on this page is AI-generated and may contain mistakes. Verify any details that matter before acting on them.
ReloMaps may earn a commission from affiliate links at no extra cost to you.

