
Photo: Wikipedia
Demographics of Hamilton, TX
Affluence Level in Hamilton, TX
A low-income area with significant economic hardship. Household wealth and educational attainment are well below national averages.
People of Hamilton, TX
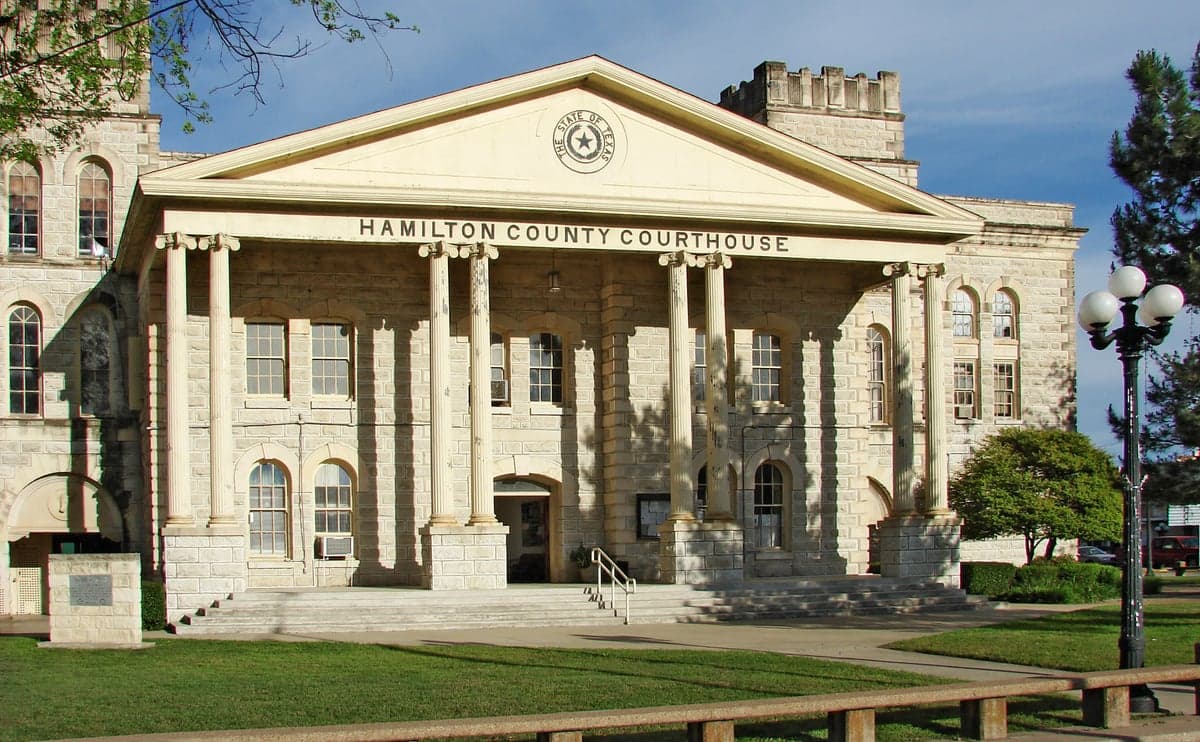
The people of Hamilton, Texas today form a small, predominantly White community of 2,904 residents, with a notable and growing Hispanic minority comprising 17.9% of the population. The city’s character is rooted in its agricultural and ranching heritage, with a tight-knit, family-oriented culture that leans conservative. With a foreign-born population of just 6.4% and a very low college attainment rate of 14.8%, Hamilton remains a working-class town where generational ties to the land and local institutions like the Hamilton County Courthouse define daily life. The population is older than the state average, and the community is marked by a quiet stability rather than rapid change.
How the city was settled and grew
Hamilton was founded in 1858 as a trading post and county seat for Hamilton County, drawing its first settlers from the American South, particularly Tennessee and Kentucky. These early arrivals were drawn by the promise of cheap, fertile land for cotton farming and cattle ranching, a pattern that continued through the late 19th century. The original settlement clustered around the courthouse square, an area now known as Downtown Hamilton, where the first general stores, blacksmith shops, and saloons served the surrounding farm families. A second wave of settlers, primarily German and Czech immigrants, arrived in the 1870s and 1880s, establishing farms to the east and south of town in what is now the Eastside Neighborhood, where their descendants still own many of the original homesteads. The arrival of the Gulf, Colorado and Santa Fe Railway in 1881 spurred a modest population boom, with new businesses and homes spreading north along what became Rice Street, a corridor that remains a residential backbone of the city. By 1900, Hamilton’s population had reached roughly 1,500, and the town’s identity as a conservative, agrarian community was firmly set.
Modern era (post-1965)
The post-1965 era brought gradual demographic shifts to Hamilton, though the city remained overwhelmingly White. The Immigration and Nationality Act of 1965 had little immediate effect here, as Hamilton was not a destination for the large-scale immigration seen in Texas cities. Instead, the most significant change was domestic: the mechanization of agriculture in the 1970s and 1980s pushed many younger residents to seek work in larger cities like Waco and Fort Worth, leading to a slow population decline from a peak of around 3,200 in 1960 to the current 2,904. The Hispanic population began to grow noticeably in the 1990s, driven by families moving from the Rio Grande Valley and Mexico to work in the region’s poultry processing plants and ranches. These newer residents concentrated in the Southside area, south of the railroad tracks, where more affordable housing and rental properties are available. Today, the Hispanic community is most visible in the West Hamilton neighborhood, near the Hamilton High School campus, where a small but growing number of Hispanic-owned businesses have opened along Highway 36. The Black population remains negligible at 0.3%, reflecting the area’s historical lack of industrial or urban pull factors that attracted African American migrants elsewhere in Texas. The Asian and Indian populations are effectively zero, consistent with the town’s limited economic diversification and lack of a university or major employer to draw skilled immigrants.
The future
Hamilton’s population is projected to remain stable or decline slightly over the next 10–20 years, as the city lacks the job growth or housing development to attract significant in-migration. The Hispanic share is expected to continue its slow rise, potentially reaching 25–30% by 2040, driven by natural increase and continued movement from other parts of Texas. This growth will likely concentrate in the Southside and West Hamilton neighborhoods, where housing is most affordable. The White population, meanwhile, is aging and shrinking, with many younger adults leaving for college and not returning. The city’s cultural identity is evolving slowly: the annual Hamilton County Fair and the Cowboy Church remain central institutions, but Spanish-language services at local churches and bilingual signage at some businesses are becoming more common. New residential development is limited to a few infill lots and a small subdivision called Oak Ridge Estates on the northern edge of town, which has attracted a handful of retirees from Dallas-Fort Worth seeking a lower cost of living. No major employer or infrastructure project is on the horizon to reverse the demographic trends.
For someone moving in now, Hamilton offers a stable, affordable, and deeply traditional community where change comes slowly. The population is becoming slightly more diverse, but the town’s core identity as a White, working-class, conservative farming community remains intact. New residents, particularly those from outside Texas, should expect a quiet, insular social environment where church and family ties dominate, and where the pace of life is dictated by the seasons and the local school calendar rather than by urban trends.

* Values derived from national, state, county, city and local statistics and may differ in a specific area. Last updated: 2026-10-27T12:34:14.000Z
Narrative content on this page is AI-generated and may contain mistakes. Verify any details that matter before acting on them.
ReloMaps may earn a commission from affiliate links at no extra cost to you.

