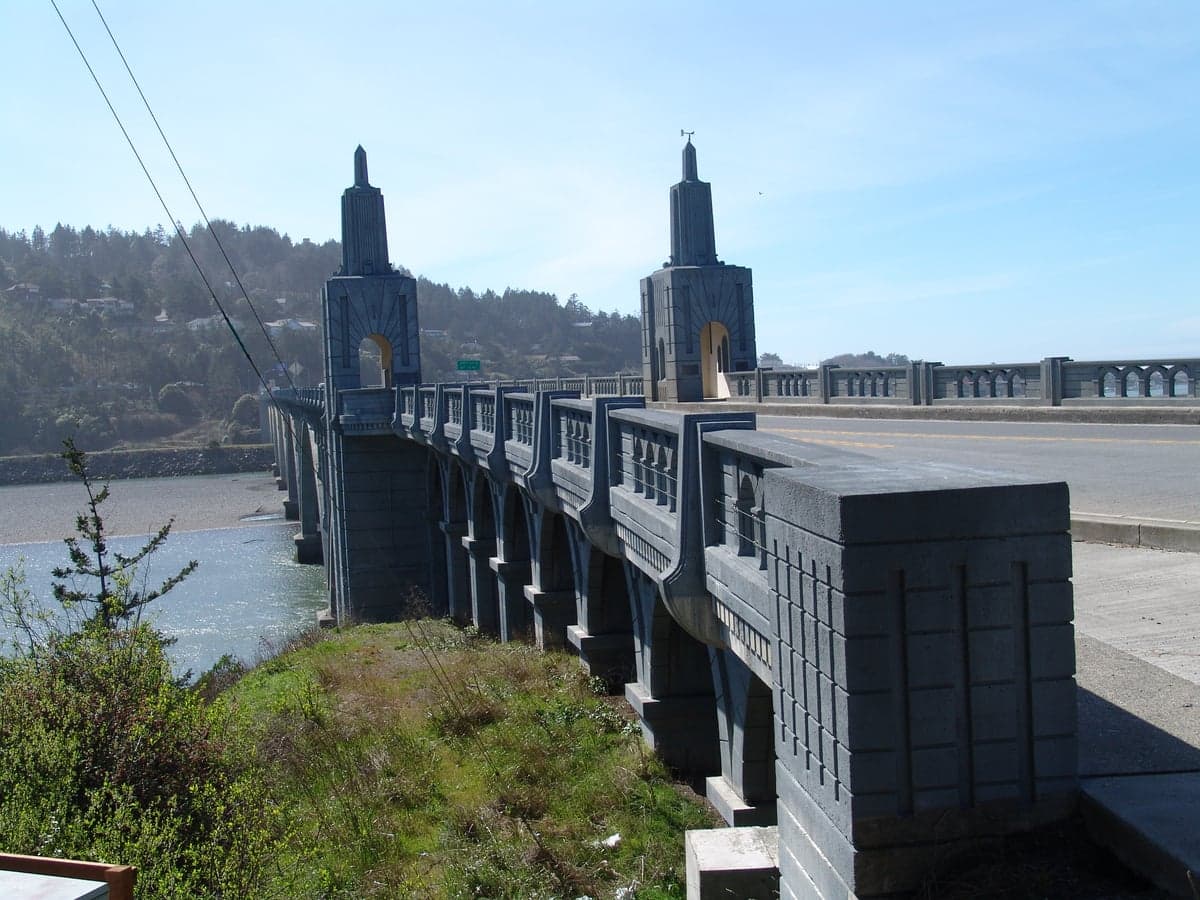
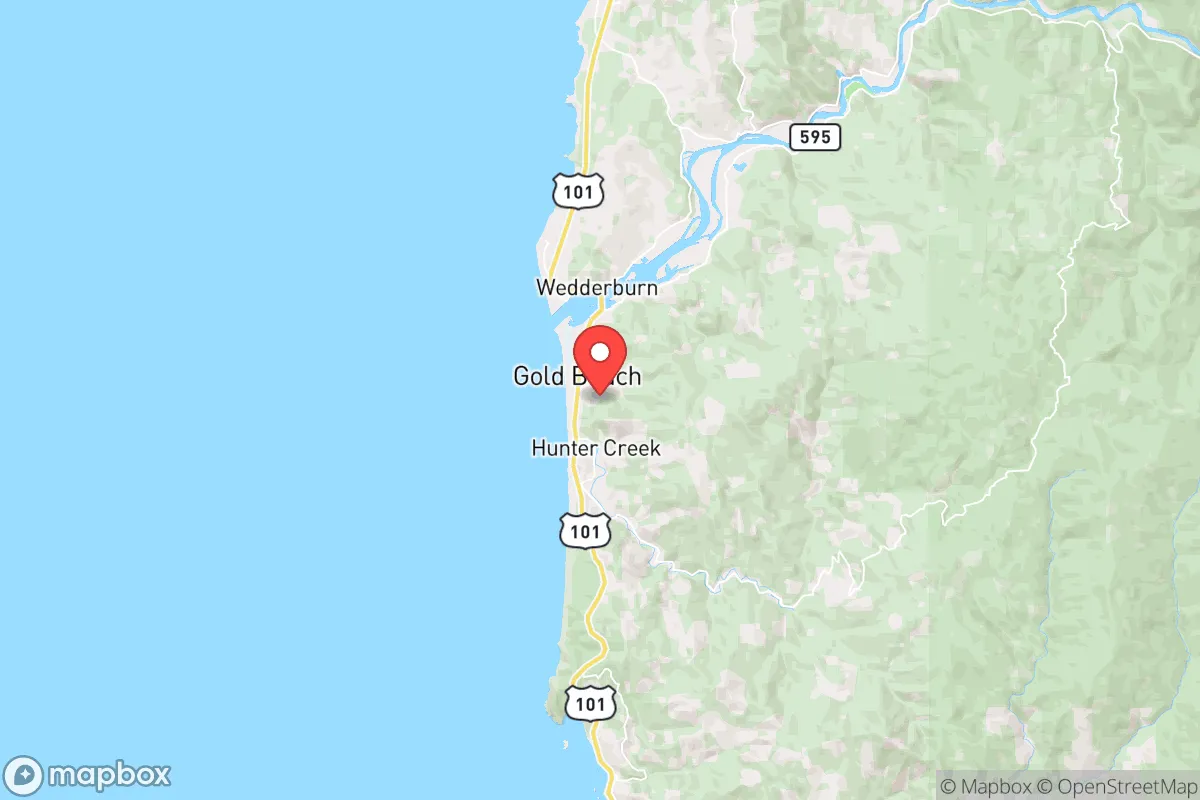
Photo: Wikipedia
Quality of Life in Gold Beach, OR
A high quality of life with strong walkability, manageable living costs, healthy neighborhood signals, and solid amenity access.
What does Quality of Life tell us?
Quality of Life blends cost of living, nearby amenities, socioeconomic signals, and neighborhood character. City-level scores represent the whole municipality; individual neighborhoods can differ.
What does this tell us?
Quality of Life blends cost of living, nearby amenities, socioeconomic signals, and neighborhood character. City-level scores represent the whole municipality; individual neighborhoods can differ.
Cost of Living
9% above national average
The Real Cost of Living in Gold Beach, OR for 2026
| Tier | Individual | Family (4) |
|---|---|---|
| Survival | $17k | $33k |
| Comfortable | $58k | $86k |
| Luxury | $86k+ | $133k+ |
| Elite (Top 5%) | $101k+ | $156k+ |
60%
The Area Signal
A metric tracking the socioeconomic signals of the area.
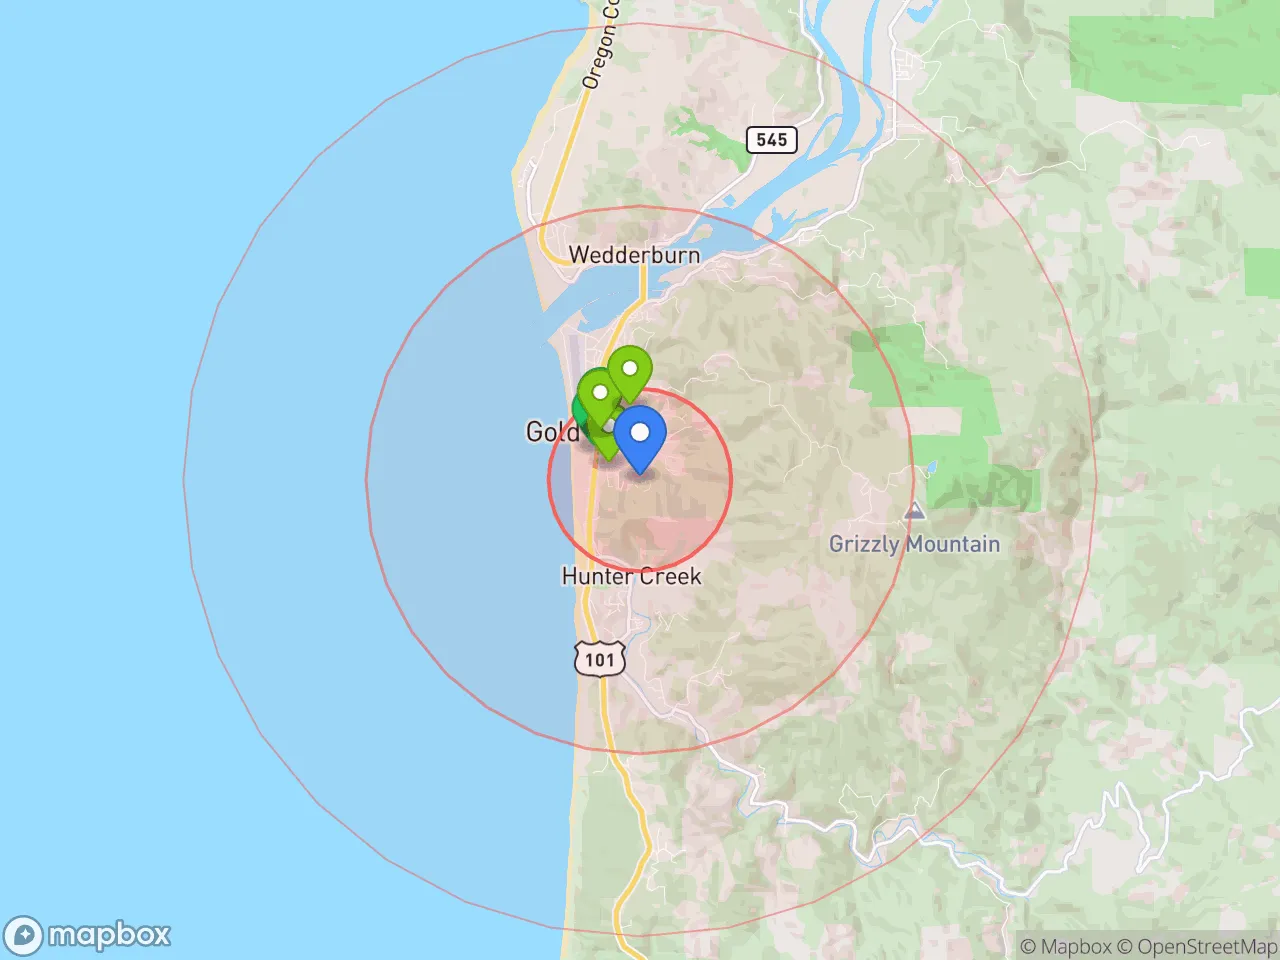
Hobbies
Explore the areaGroceries
0 within 10 miles
Gas
3 within 10 miles
Hospital
1 within 20 miles
Airport
PDX — Portland International
Post Office
USPS — Gold Beach, OR
Critical Amenities
Quality-of-Life Analysis
Gold Beach, Oregon, offers a quality of life defined by coastal isolation and a slower economic baseline rather than affluence — the cost of living index sits at 109 (9% above the U.S. average), yet median home values of $368,900 and median rents of $1,094 remain well below Oregon's larger coastal metros like Astoria or Newport. The permanent population of roughly 2,300 skews toward retirees, remote workers, and commercial fishing families who accept fewer conveniences in exchange for direct access to the Rogue River and the Pacific Ocean. This is not a wealthy enclave; it is a working-town lifestyle where the median commute of 23.2 minutes reflects the practical distance between home, harbor, and the U.S. Highway 101 corridor.
Cost of living and housing affordability compared to nearby coastal towns
Gold Beach's housing market is the clearest affordability advantage in Curry County. The median home value of $368,900 is roughly 15% cheaper than comparable properties in Brookings (about 30 miles south) and significantly under the Oregon statewide median of approximately $440,000. Renters fare even better: the median rent of $1,094 is nearly $300 below the national average for coastal communities, though inventory is tight and seasonal vacation rentals compress the year-round supply. The 109 cost-of-living index is driven almost entirely by groceries and utilities — shipping costs to this remote stretch of the southern Oregon coast push food prices about 12% above national norms. Property taxes remain a relative bargain, with Curry County's effective rate near 0.8%, but buyers should expect limited inventory and cash-heavy competition from out-of-state purchasers seeking second homes.
Local amenities, schools, and the rhythm of daily life
Daily life in Gold Beach revolves around the Rogue River, the harbor, and a compact downtown strip along Highway 101. The Central Curry School District serves roughly 700 students across Gold Beach High School and Riley Creek Elementary, with class sizes averaging under 20 — a draw for families, though advanced course offerings are limited compared to Grants Pass or Medford, both about 90 minutes inland. Amenities are functional rather than abundant: a Safeway anchors grocery shopping, the Curry Health District hospital provides primary and emergency care, and the Gold Beach Books independent shop anchors a small retail scene. The Prehistoric Gardens and the Cape Sebastian State Scenic Corridor offer recreation within a 15-minute drive, while the 32-mile Rogue River Trail and jet boat tours define the area's tourism identity. For workers, the largest employers are the school district, Curry Health, and the commercial fishing fleet; remote workers rely on Starlink or cable internet that remains slower and less reliable than in urban Oregon.
Residents accept trade-offs that would frustrate many urbanites: the nearest Costco is a 2.5-hour drive to Grants Pass, and specialty medical care requires travel to Medford or even Portland. Restaurants close early, and the social calendar peaks in summer with salmon runs and the Oregon Coast Music Festival's southern stops. Winters bring heavy rain — over 80 inches annually — and a quiet that some find isolating.
Gold Beach suits those who prioritize outdoor access, low crime, and a tight-knit community over career density or cultural variety. Retirees with flexible healthcare needs, remote workers with stable internet, and fishing-industry families will find the affordability and pace compelling. Professionals seeking year-round dining, robust schools, or quick airport access should look inland to Grants Pass or north to Coos Bay instead.

Crime in Gold Beach, OR
Crime rates similar to the national median for U.S. locations.
Violent CrimeViolent Crime Analysis
Property CrimeProperty Crime Analysis
Crime Analysis
Gold Beach, Oregon, reports a violent crime rate of 312.8 incidents per 100,000 residents and a property crime rate of 2,141 per 100,000, painting a picture of a small coastal town where property offenses are the primary concern. While the violent crime figure sits near the national average, the property crime rate is notably elevated, driven largely by theft and vehicle-related offenses common in tourism-dependent communities along the southern Oregon coast. For a town of roughly 2,300 year-round residents, the raw numbers translate to a handful of violent incidents annually but dozens of property crimes that disproportionately affect both locals and seasonal visitors.
Crime in context
Compared to Oregon's statewide averages, Gold Beach's violent crime rate of 312.8 per 100K is slightly below the state figure of approximately 380 per 100K, while its property crime rate of 2,141 per 100K runs well above the Oregon average of roughly 2,900 per 100K — actually, that figure is lower than the state average, which hovers near 2,900 per 100K. Nationally, the U.S. violent crime rate stands at about 380 per 100K, placing Gold Beach in a relatively safer bracket for serious offenses. However, the property crime picture is less reassuring: the national rate is approximately 1,950 per 100K, meaning Gold Beach's 2,141 figure exceeds the typical American community by about 10%. The gap is largely attributable to theft from vehicles and break-ins at vacation rentals, which spike during the summer tourism season from Memorial Day through Labor Day.
What residents experience
Daily life in Gold Beach is shaped more by nuisance-level property crime than by violent confrontation. Residents report that unlocked cars and outbuildings are the most common targets, with the Curry County Sheriff's Office and Gold Beach Police Department responding to a steady stream of theft reports from the Harbor area and along Jerry's Flat Road. The town's geography — a narrow strip between the Pacific Ocean and the Rogue River — means most neighborhoods are compact, and residents often know their immediate neighbors, which helps deter more serious crimes. Domestic disputes and alcohol-related incidents account for the majority of the violent crime that does occur, typically concentrated in the bar district along Ellensburg Avenue on weekend nights. Notably, Gold Beach has not experienced the gang-related violence or organized retail theft rings seen in larger Oregon cities like Medford or Grants Pass, and the Curry County District Attorney's office maintains a prosecution rate for felony property crimes that exceeds the state average.
Neighborhood-level variation
Crime is not evenly distributed across Gold Beach. The most reliable rule of thumb is that areas with higher rental turnover and tourist foot traffic see more property crime. The Ocean View Drive corridor and the rental-heavy stretch near the Rogue River bridge report the highest number of theft incidents, while the established residential neighborhoods east of Highway 101 — particularly around South Bank Chetco River Road and the hills above the airport — see significantly lower rates. The Wedderburn area across the river, technically in Curry County's jurisdiction, has a slightly higher incidence of drug-related property crime. For those considering a move, the safest bet is the residential core between 5th and 10th Streets, where long-term homeowners and active neighborhood watch participation keep reported crime near zero. As with any small town, the most effective safety strategy is simple: lock vehicles, secure outbuildings, and maintain visibility with neighbors.
* Values derived from national, state, county, city and local statistics and may differ in a specific area. Last updated: 2026-10-29T04:45:54.000Z
Narrative content on this page is AI-generated and may contain mistakes. Verify any details that matter before acting on them.
ReloMaps may earn a commission from affiliate links at no extra cost to you.

