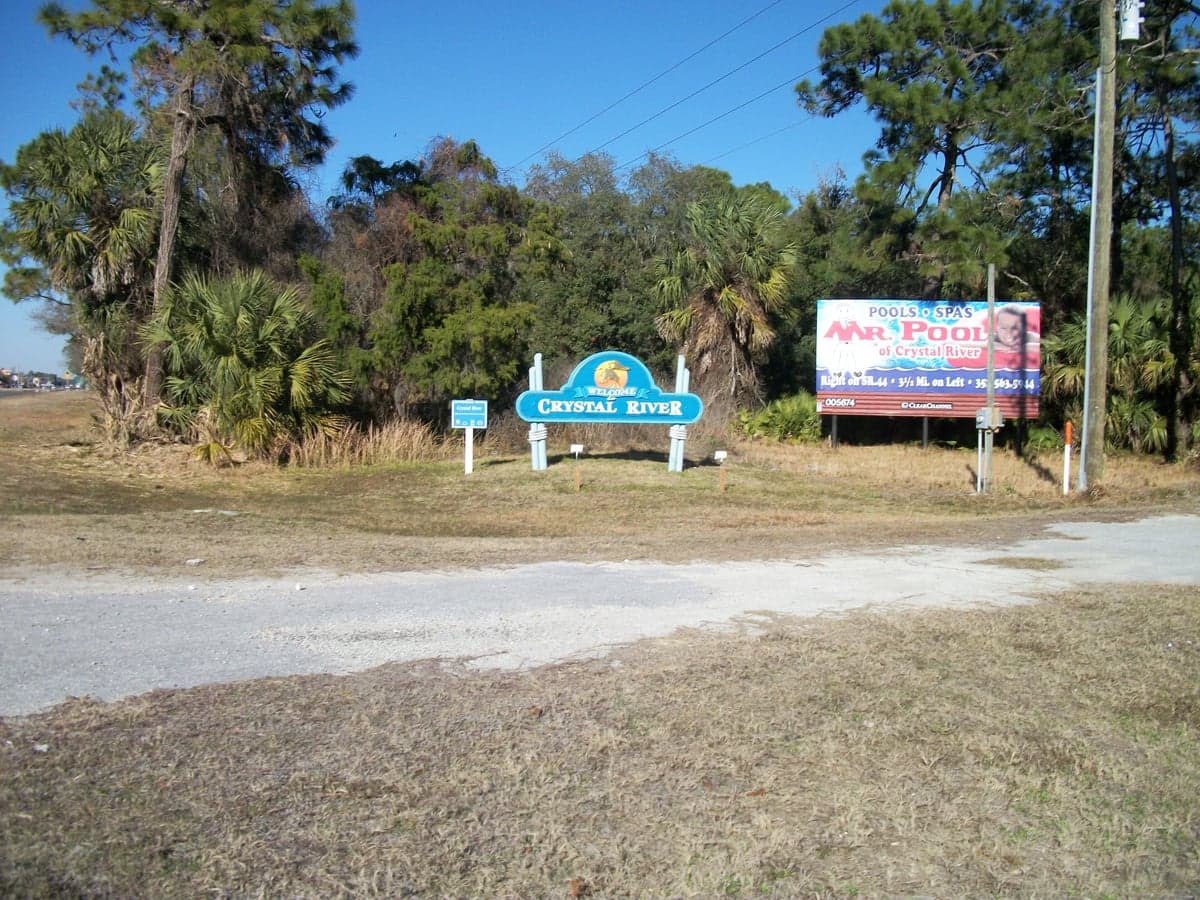
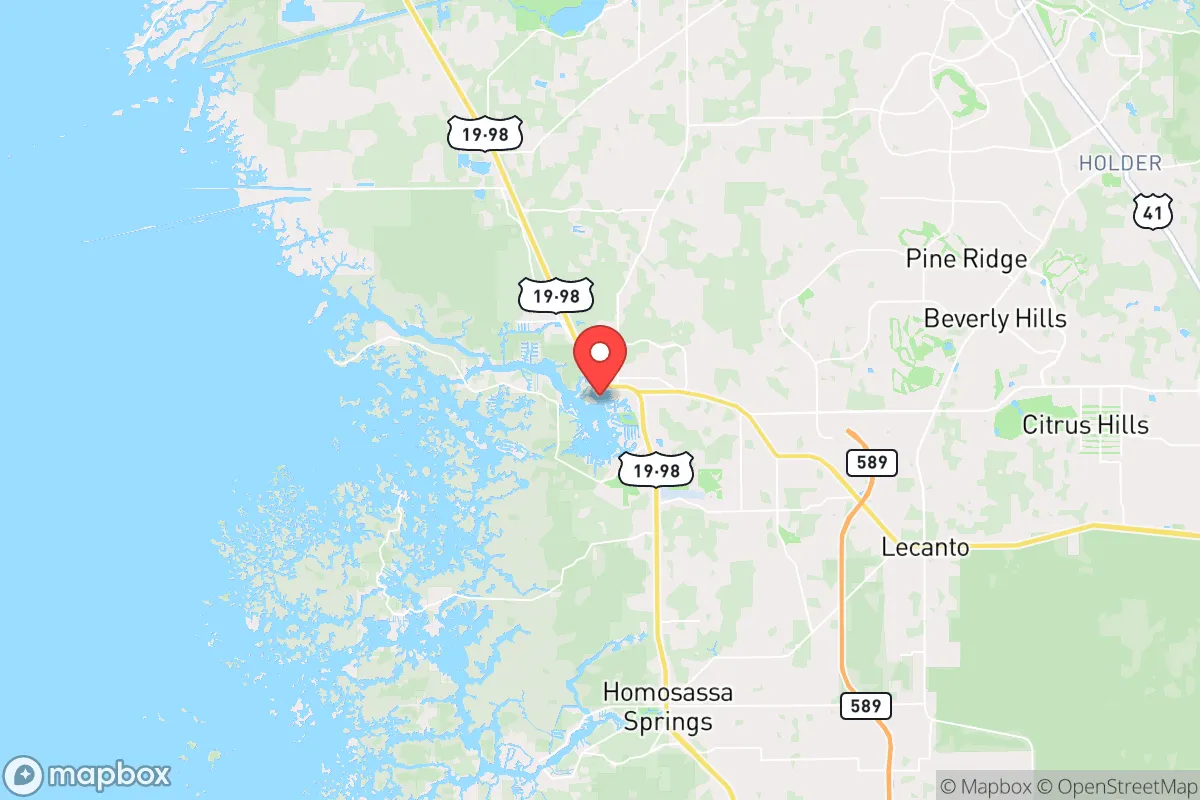
Photo: Wikipedia
Demographics of Crystal River, FL
Affluence Level in Crystal River, FL
A middle-class area roughly in line with national averages across income, home values, education, and employment.
People of Crystal River, FL
Crystal River, Florida, is a small city of 3,443 residents with a distinctly older, predominantly white character, where 80.1% of the population identifies as White and over a third hold a college degree. The city’s identity is shaped by its role as a tourism and retirement hub along the Gulf Coast, with a notably low foreign-born share of just 1.5% and a Black population of 10.6% that reflects a modest but historic presence. Its people are a mix of multi-generational fishing families, second-home owners, and retirees drawn by the springs and the quiet pace of life, giving the city a stable, conservative-leaning social fabric.
How the city was settled and grew
Crystal River’s human history begins long before its incorporation in 1903, with the pre-Columbian mound-builders of the Crystal River Archaeological State Park, but the modern population dates to the late 19th and early 20th centuries. The city was originally a steamboat stop and fishing village, settled by Anglo-American farmers and fishermen from the Deep South who cleared the coastal hammocks for citrus and timber. The arrival of the railroad in the 1890s opened the area to small-scale tourism and winter residents, and the historic Downtown Crystal River district—centered on Citrus Avenue and Kings Bay—was built by these early Anglo families, who erected the wood-frame houses and storefronts that still line the core. A small Black community formed during the same period, concentrated in the West Crystal River area near the railroad tracks, where descendants of freedmen worked as laborers in the citrus groves and fish houses. By 1950, the population hovered around 1,500, overwhelmingly native-born White, with a Black share near 15%—a pattern typical of small Gulf Coast towns with a plantation-era legacy but no large-scale immigrant influx.
Modern era (post-1965)
After the 1965 Immigration and Nationality Act, Crystal River saw almost no foreign-born growth—its foreign-born share today is just 1.5%, far below the national average—because the city lacked the industrial or agricultural jobs that drew immigrants to larger Florida metros. Instead, the post-1965 era was defined by domestic in-migration: retirees and second-home buyers from the Midwest and Northeast, drawn by the manatee-viewing at Kings Bay and the low cost of living. These newcomers settled primarily in newer subdivisions on the city’s periphery, such as Ozello (a coastal enclave west of the city limits) and the Fort Island Gulf Beach area, where ranch-style homes and canal-front lots replaced old groves. The Black population declined from its historic share to 10.6% today, as younger Black families moved to larger cities like Ocala or Tampa for employment, while the White share rose to 80.1% as affluent retirees replaced the aging local workforce. The Hispanic share, at 5.3%, is almost entirely domestic—Puerto Rican and Mexican-American families who moved from other parts of Florida for service-industry jobs in tourism and healthcare, settling in the North Crystal River corridor along U.S. 19. East and Southeast Asian residents (0.6%) and Indian-subcontinent residents (0.0%) are negligible, reflecting the city’s lack of the tech or university sectors that attract those populations to larger Florida cities.
The future
Crystal River’s population is projected to grow slowly, driven by continued domestic retirement migration and limited new construction, rather than by international immigration or diversification. The city’s age profile is skewing older—the median age is well above the state average—and the under-35 population is shrinking as young adults leave for college and urban jobs. New residential development is concentrating in the Crystal River Airport area and along the West Fort Island Trail, where planned 55+ communities and single-family subdivisions are absorbing the retiree influx. The Hispanic share may rise modestly as service workers fill gaps in hospitality and healthcare, but the foreign-born share is unlikely to exceed 3% in the next decade given the absence of employer-sponsored immigration or refugee resettlement programs. The Black population is stable but aging, with little new in-migration from outside the region. Over the next 10-20 years, Crystal River will likely become slightly more Hispanic and slightly older, but its core identity as a predominantly White, native-born, retiree-oriented town will persist, with diversity remaining low compared to Florida as a whole.
For someone moving to Crystal River now, the city offers a stable, low-diversity environment where the population is shaped by domestic retirees and long-time local families rather than by international arrivals. The cultural identity is firmly Southern and coastal-conservative, with a pace of life that prioritizes outdoor recreation—boating, fishing, manatee tours—over urban amenities. Newcomers will find a community that is welcoming but insular, where social networks are built through church, civic clubs, and waterfront neighbors, and where demographic change is slow enough to feel almost imperceptible year to year.

* Values derived from national, state, county, city and local statistics and may differ in a specific area. Last updated: 2026-11-20T05:20:32.000Z
Narrative content on this page is AI-generated and may contain mistakes. Verify any details that matter before acting on them.
ReloMaps may earn a commission from affiliate links at no extra cost to you.

