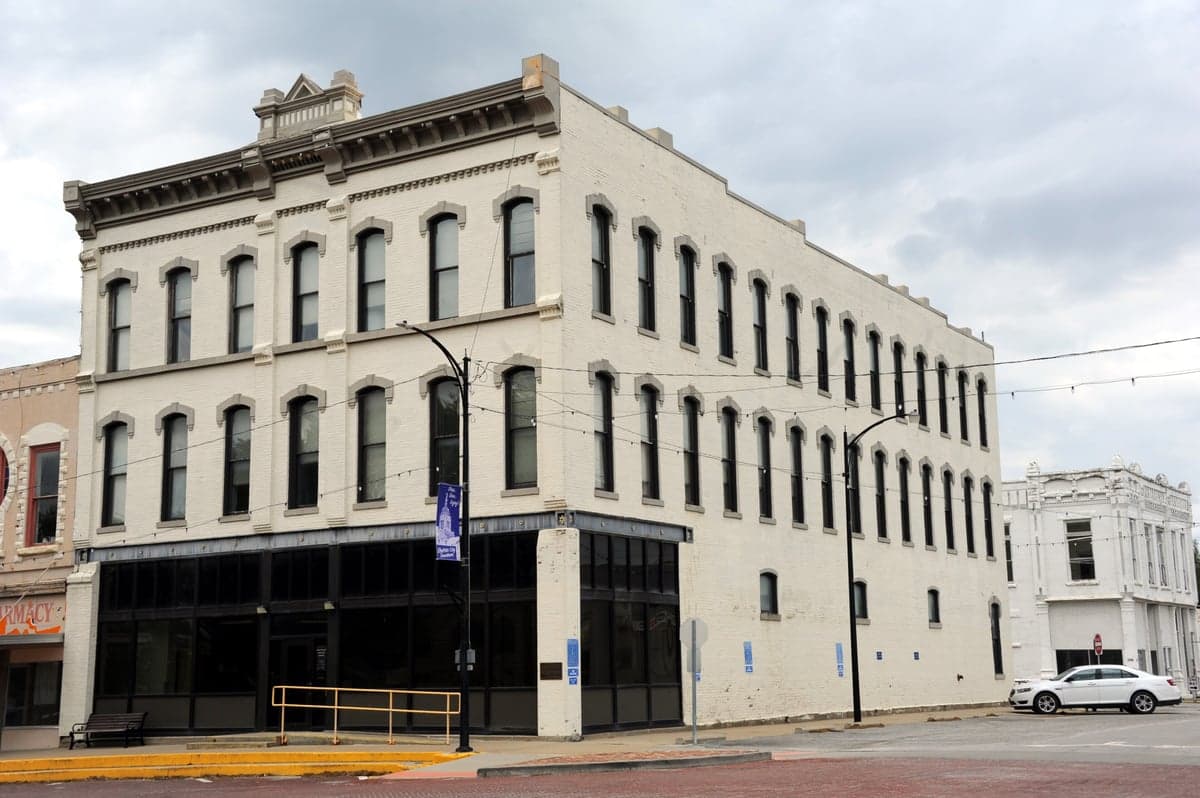
Photo: Wikipedia
Demographics of Butler, MO
Affluence Level in Butler, MO
A below-average socioeconomic profile. Incomes, home values, and educational attainment trail the U.S., with higher poverty and unemployment.
People of Butler, MO
The people of Butler, Missouri, today number 4,594, forming a tight-knit, predominantly white community with a distinctly rural and conservative character. The city’s population is notably less diverse than the national average, with 89.0% identifying as white alone, and a foreign-born share of just 0.8%. With only 11.8% of adults holding a bachelor’s degree or higher, Butler’s identity is rooted in blue-collar work, family ties, and a slower pace of life, making it a place where generations often stay put rather than new arrivals flooding in.
How the city was settled and grew
Butler’s founding and early growth were driven by agriculture and the railroad. Platted in 1854 as the seat of Bates County, the city was named after a U.S. senator and drew its first settlers—mostly farmers of German and Scotch-Irish descent—who were attracted by cheap, fertile land in the Osage Plains. The Missouri Pacific Railroad arrived in the 1870s, turning Butler into a regional shipping hub for grain and livestock. The original settlement clustered around the courthouse square, an area now known as Downtown Butler, where the first general stores, blacksmiths, and saloons served the surrounding farm population. A second wave of growth came in the 1880s and 1890s, when a small number of Italian and Polish immigrant families arrived to work on railroad construction and in the new flour mills. These families settled just east of the tracks in what is still called Railroad Addition, a neighborhood of modest frame houses that remains a working-class enclave. By 1900, Butler’s population had reached roughly 2,000, and the city’s character as a quiet, agricultural service town was firmly set.
Modern era (post-1965)
After the 1965 Hart-Cellar Act, Butler saw almost no new immigration. The foreign-born share has remained below 1% for decades, and the city’s demographic story since the 1970s is one of domestic stability rather than ethnic change. The most significant population shift has been a slow, steady out-migration of younger adults seeking jobs in Kansas City (about 60 miles north) or Springfield, leaving an aging population behind. The small Black population, which stood at roughly 5% in the 2000 census, has held steady at 4.3% today, concentrated in the Southside neighborhood along Business 71, where a few Black families have lived since the post-World War II era. The Hispanic share, now 3.4%, has grown modestly since 2000, driven by a handful of families working in the poultry processing plant and local farms; these newer residents have settled mostly in West Butler, near the industrial park. The East/Southeast Asian population (0.9%) is tiny and scattered, with no distinct ethnic enclave. The Indian-subcontinent population is effectively zero. Suburbanization never really reached Butler—no large subdivisions were built after the 1970s—so the city’s housing stock remains dominated by older single-family homes in neighborhoods like North Park and Hillcrest, both developed in the 1950s and 1960s for returning veterans and their families.
The future
Butler’s population is projected to remain flat or decline slightly over the next 10–20 years. The city’s demographic future is one of slow aging and modest diversification, not rapid change. The white share is likely to edge downward as older residents pass away, while the Hispanic share could rise to 5–6% if the poultry industry expands. The Black share is expected to remain stable. No new large-scale housing developments are planned, and the city’s low college-attainment rate (11.8%) means it will continue to struggle to attract knowledge-economy workers. The Downtown area has seen some reinvestment in storefronts and a new city park, but the overall population is aging in place. The cultural identity of Butler—deeply rooted in church, family, and hunting—is unlikely to shift meaningfully. For a newcomer, this means moving into a community where most people have known each other for decades, and where change comes slowly.
For someone moving in now, Butler offers a stable, affordable, and predictable small-town life, but one with limited economic opportunity and little demographic dynamism. The city is becoming older, slightly more Hispanic, and no more diverse in its foreign-born population. It remains a place where roots run deep, and where new residents will need to be intentional about building connections in a community that has not seen a wave of newcomers in generations.

* Values derived from national, state, county, city and local statistics and may differ in a specific area. Last updated: 2026-10-06T18:16:03.000Z
Narrative content on this page is AI-generated and may contain mistakes. Verify any details that matter before acting on them.
ReloMaps may earn a commission from affiliate links at no extra cost to you.

