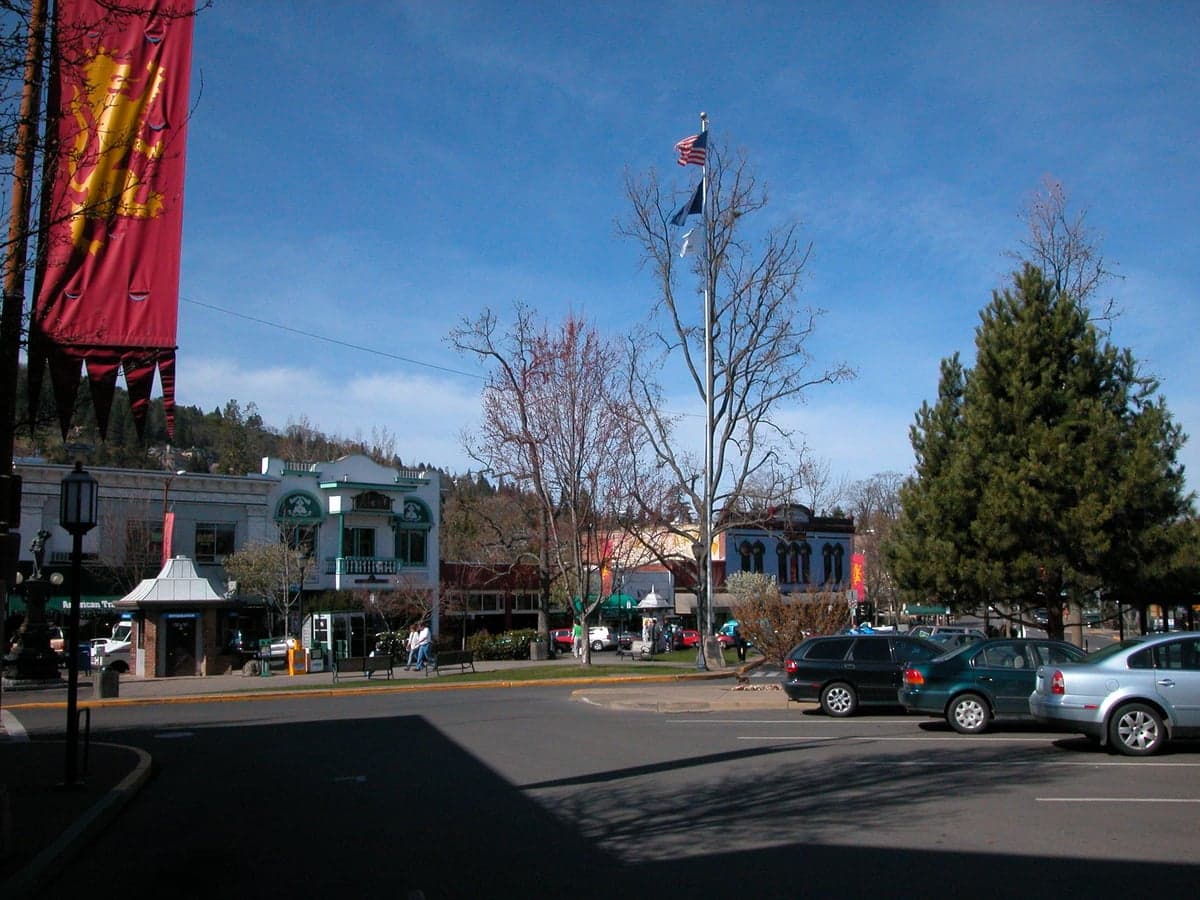
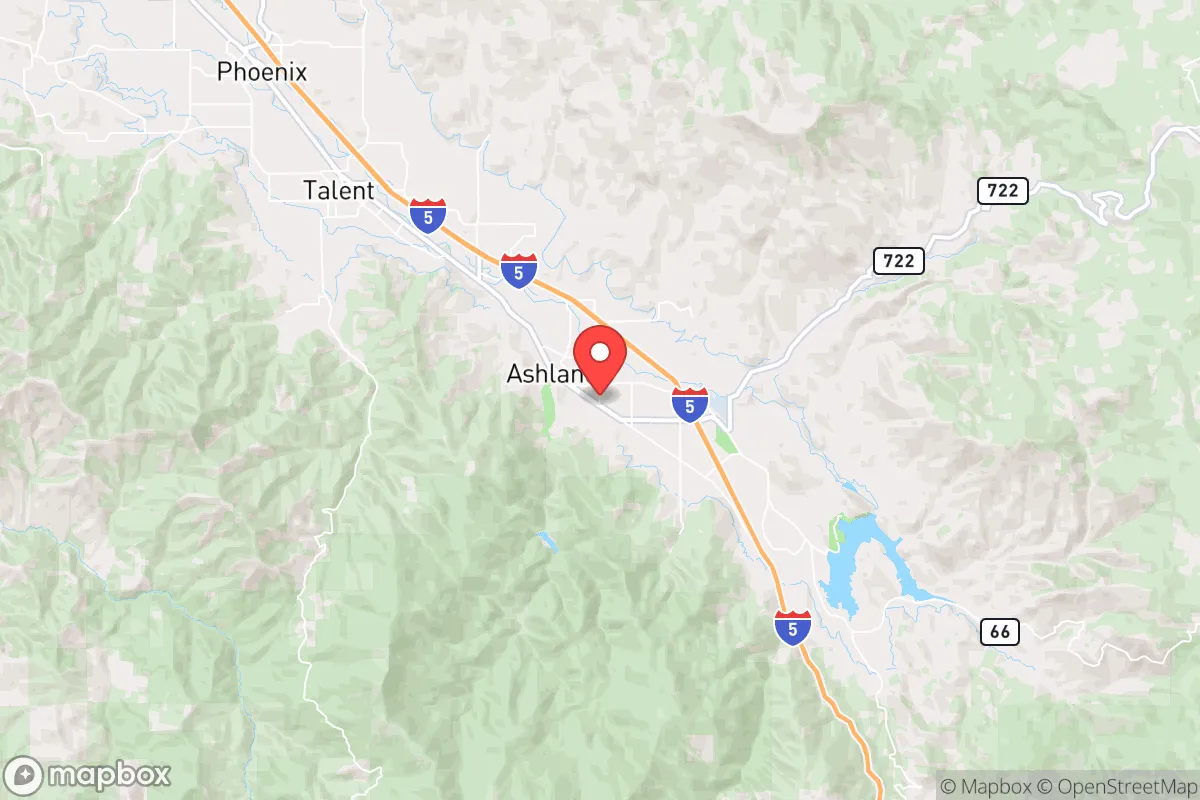

Photo: Wikipedia
Quality of Life in Ashland, OR
A high quality of life with strong walkability, manageable living costs, healthy neighborhood signals, and solid amenity access.
What does Quality of Life tell us?
Quality of Life blends cost of living, nearby amenities, socioeconomic signals, and neighborhood character. City-level scores represent the whole municipality; individual neighborhoods can differ.
What does this tell us?
Quality of Life blends cost of living, nearby amenities, socioeconomic signals, and neighborhood character. City-level scores represent the whole municipality; individual neighborhoods can differ.
Cost of Living
52% above national average
The Real Cost of Living in Ashland, OR for 2026
| Tier | Individual | Family (4) |
|---|---|---|
| Survival | $22k | $41k |
| Comfortable | $99k | $146k |
| Luxury | $130k+ | $201k+ |
| Elite (Top 5%) | $171k+ | $265k+ |
49%
The Area Signal
A metric tracking the socioeconomic signals of the area.
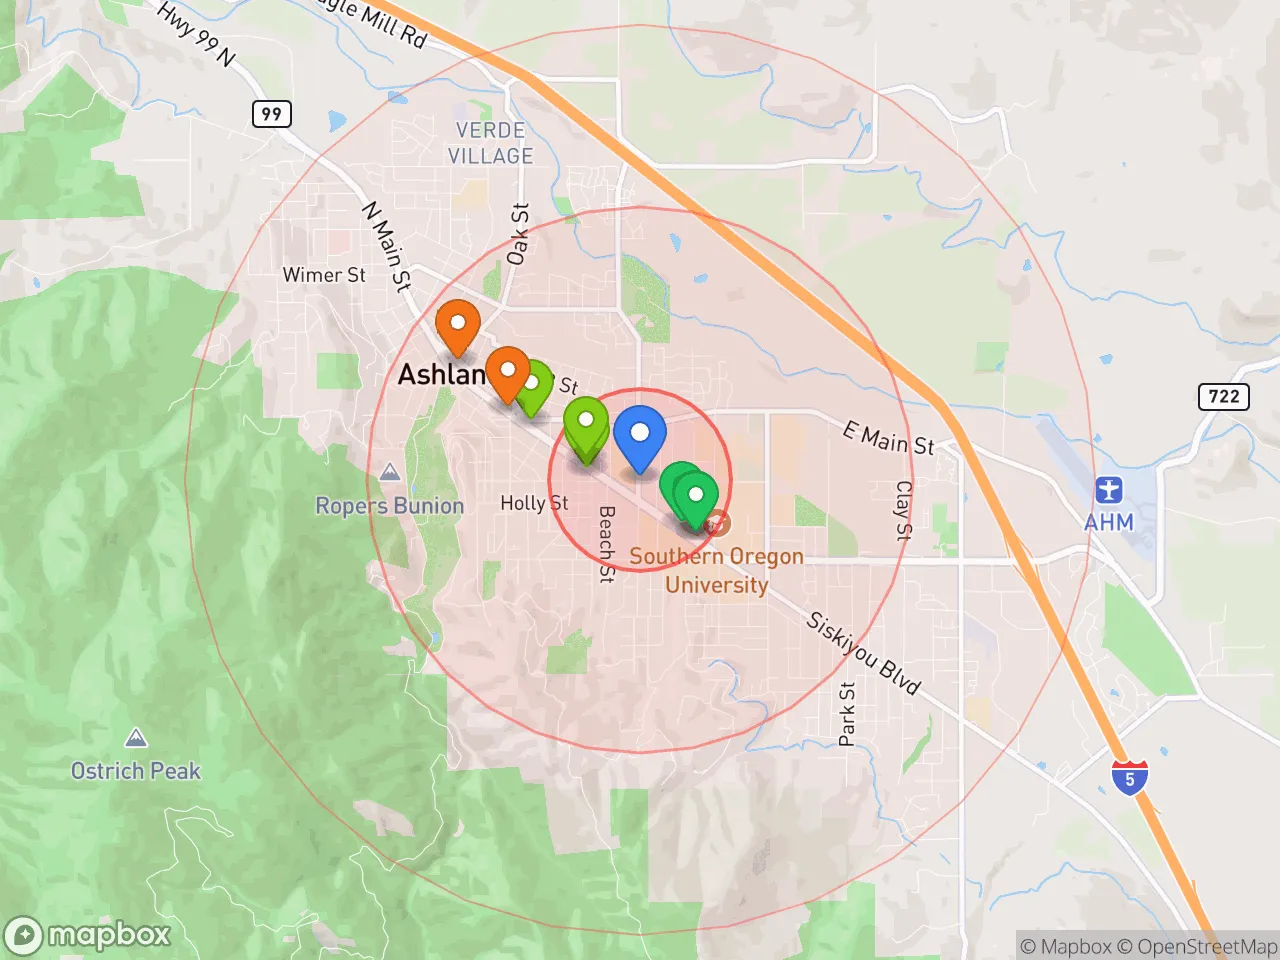
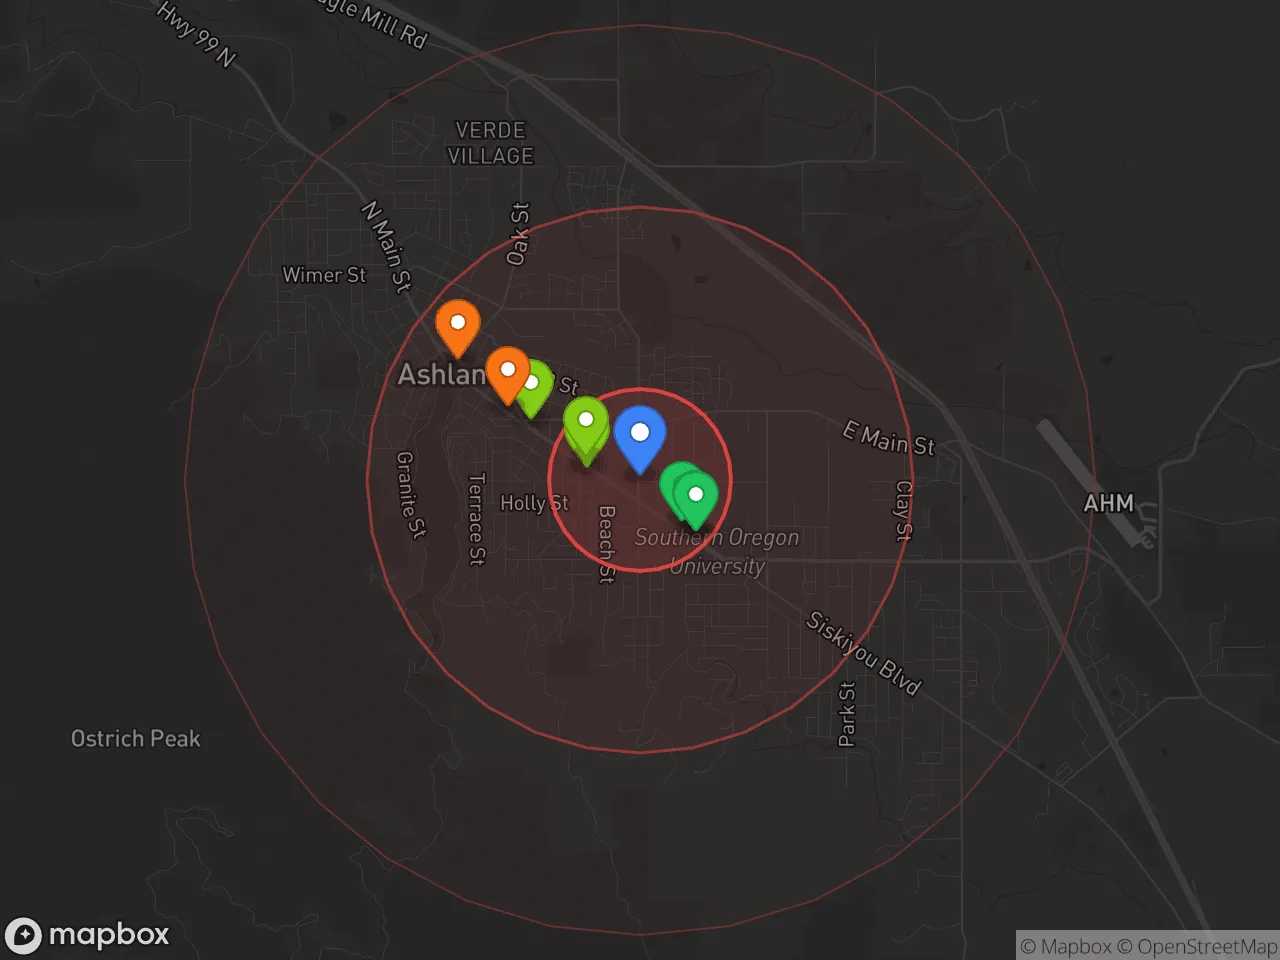
Hobbies
Explore the areaGroceries
2 within 10 miles
Gas
16 within 10 miles
Hospital
4 within 20 miles
Airport
PDX — Portland International
Post Office
USPS — 120 North 1st Street, Ashland
Critical Amenities
Quality-of-Life Analysis
Ashland, Oregon, is a notably affluent and culturally driven community, drawing a population of academics, artists, retirees, and professionals who prioritize lifestyle over raw economic growth. With a cost of living index of 152 (52% above the U.S. average), the city commands a premium for its natural beauty, the Oregon Shakespeare Festival, and proximity to Southern Oregon University. The typical resident is college-educated, values progressive politics, and is willing to pay more for walkable streets, mountain views, and a vibrant downtown core.
Cost of living, housing affordability, and how Ashland compares to Medford
Ashland’s housing market is the primary driver of its high cost of living. The median home value sits at $573,700, roughly double the median in nearby Medford (approximately $285,000) and significantly above the Oregon state median of about $450,000. This premium reflects Ashland’s desirability and limited inventory within the Rogue Valley. Renters face a median rent of $1,367, which, while lower than Portland’s average, is still steep for the region. The average commute is a remarkably short 16.9 minutes, a direct benefit of living in a compact city where most jobs, schools, and amenities are within a 5-mile radius. For comparison, Medford’s average commute is about 19 minutes, and the national average is 27 minutes. This short commute effectively offsets some of the housing cost by reducing transportation expenses and reclaiming personal time. However, first-time homebuyers and middle-income families often find themselves priced out of Ashland and instead look to Talent or Phoenix for more affordable options while still commuting into town for work or entertainment.
What daily life is like for families, retirees, and culture seekers
Daily life in Ashland revolves around a walkable downtown core, the Lithia Park system, and a calendar packed with performing arts. The Ashland School District is highly rated, with Ashland High School consistently ranking among the top 10% of Oregon high schools for college readiness. Southern Oregon University provides a steady influx of young adults and cultural programming, including the Oregon Center for the Arts. For retirees, the city offers the Osher Lifelong Learning Institute (OLLI) and numerous hiking trails on Mount Ashland. The rhythm of life is slower than in a metro area, but the presence of the Oregon Shakespeare Festival (running nine months a year) ensures a sophisticated dining and arts scene uncommon for a city of roughly 21,000 residents. Groceries and services are slightly more expensive than in Medford (about 10-15% higher), but residents accept this premium for the ability to walk to the Saturday farmers market or catch a play without driving. The city’s strict land-use policies and environmental ethos mean that big-box retail is limited, preserving a small-town feel that appeals strongly to those fleeing suburban sprawl.
Ashland is best suited for those who can afford its housing premium and value cultural enrichment, outdoor recreation, and a tight-knit community over low costs or rapid career advancement. Remote workers with six-figure incomes, tenured professors, and retirees with equity from higher-cost markets (like the Bay Area or Portland) find the trade-off worthwhile. Families should be prepared for a competitive housing market and higher childcare costs, while young professionals may find the job market limited outside of education, healthcare, and hospitality. Ultimately, Ashland rewards those who prioritize quality of life metrics—short commutes, clean air, arts access, and walkability—over raw affordability.

Crime in Ashland, OR
Generally safer than 70% of comparable U.S. locations.
Violent CrimeViolent Crime Analysis
Property CrimeProperty Crime Analysis
Crime Analysis
Ashland, Oregon, reports a violent crime rate of 240 incidents per 100,000 residents and a property crime rate of 1,353.7 per 100,000, figures that place it above national averages for both categories. While not among the most dangerous cities in the state, these numbers signal a community where property crime is a notable concern and where the overall safety picture is mixed, particularly when considering the influence of local progressive justice policies.
Crime in context
Ashland’s violent crime rate of 240 per 100,000 is roughly 30% higher than the national average of about 180 per 100,000, though it remains below the Oregon state average. Property crime, at 1,353.7 per 100,000, significantly exceeds both the national average (approximately 1,100 per 100,000) and the Oregon state average. This disparity is especially pronounced in theft and vehicle-related offenses. The city’s location near the larger Medford metropolitan area means it experiences spillover crime from the broader Rogue Valley, a region where progressive district attorneys and judges have been criticized for implementing lenient sentencing guidelines and diversion programs. These policies, while intended to reduce incarceration, have been linked to higher recidivism rates and a perception that property crimes carry minimal consequences, emboldening repeat offenders.
What residents experience
Residents most frequently encounter property crime—burglaries, package thefts, and vehicle break-ins—particularly in areas near Southern Oregon University and downtown commercial districts. Violent crime, while less common, includes aggravated assault and occasional robbery, often tied to drug-related disputes or transient populations. Ashland’s police department has a response time averaging 8–12 minutes for priority calls, but staffing shortages have led to reduced proactive patrols. The local justice system, shaped by Jackson County’s progressive policies, has seen a 15% increase in property crime cases dismissed or diverted since 2021, according to court records. This creates a cycle where offenders cycle through the system quickly, undermining deterrence and leaving victims feeling that the justice system prioritizes offender rehabilitation over public safety.
Neighborhood-level variation is notable. The Railroad District and areas near the downtown plaza report higher property crime rates, while residential neighborhoods like Granite Street and the Ashland Hills see fewer incidents. East-side neighborhoods near the city limits experience the lowest crime rates, benefiting from less foot traffic and stronger neighborhood watch programs. However, the overall trend is concerning: property crime has risen 8% year-over-year since 2022, and violent crime, though stable, remains elevated compared to similarly sized Oregon towns like Talent or Phoenix. For prospective residents, the data suggests that while Ashland offers cultural amenities and natural beauty, its safety profile requires proactive precautions, especially regarding property security and awareness of the local justice system’s lenient approach.
* Values derived from national, state, county, city and local statistics and may differ in a specific area. Last updated: 2026-06-13T21:15:24.000Z
Narrative content on this page is AI-generated and may contain mistakes. Verify any details that matter before acting on them.
ReloMaps may earn a commission from affiliate links at no extra cost to you.

