Photo: Wikipedia
Demographics of Limestone County
Affluence Level in Limestone County
A middle-class area roughly in line with national averages across income, home values, education, and employment.
People of Limestone County
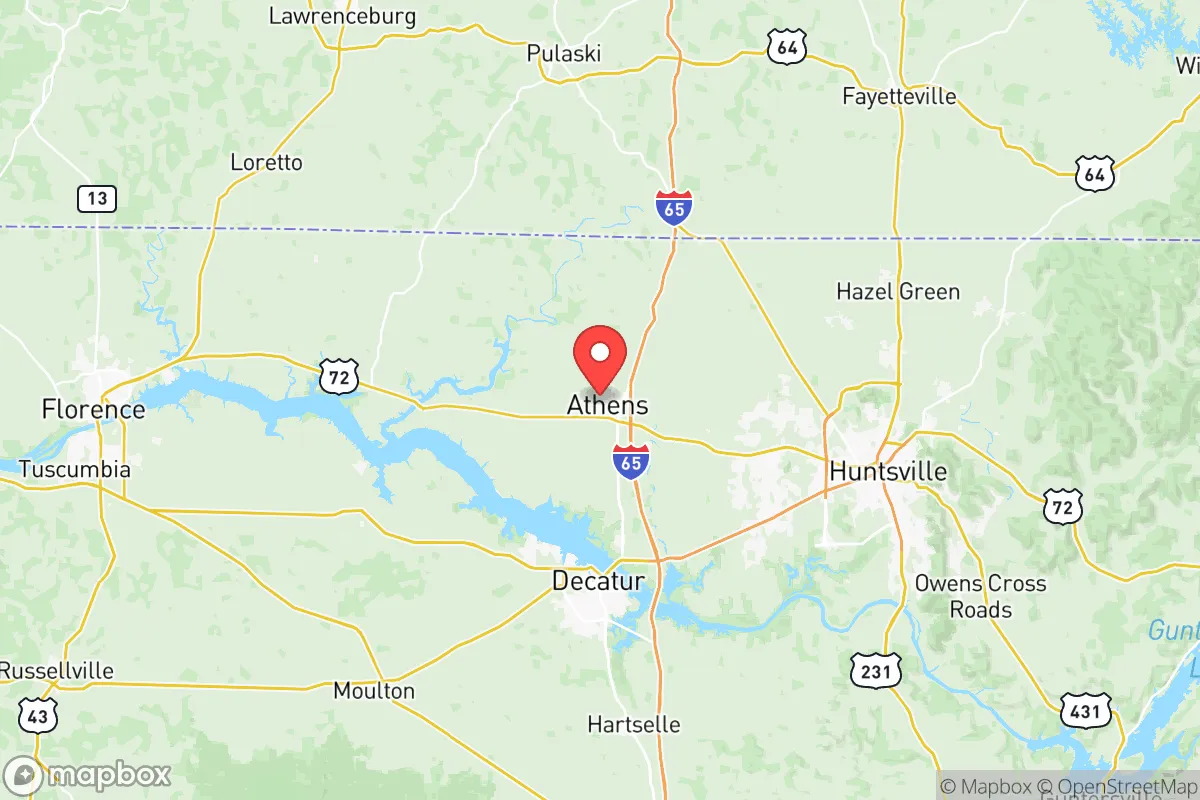
Limestone County, Alabama, is home to 107,577 residents, a population that remains predominantly white (73.5%) with a significant Black minority (12.6%) and a growing Hispanic community (7.2%). The county’s character is shaped by its position on the Tennessee River border with Tennessee, blending small-town Southern roots with the suburban expansion of nearby Huntsville and Madison. Its foreign-born population is a low 1.8%, and the college-educated share sits at 30.4%, reflecting a workforce increasingly tied to aerospace and defense industries. The people of Limestone County today are a mix of old-line families, descendants of early settlers, and newer arrivals drawn by jobs and a lower cost of living.
Settlement & growth (pre-1960)
Before American settlement, the area now known as Limestone County was part of the Cherokee and Chickasaw hunting grounds, with no permanent Native villages on record. The first European incursion came via French and British traders in the early 1700s, but no lasting settlements took hold. The land was ceded by the Cherokee in the 1806 Treaty of Tellico and by the Chickasaw in the 1816 Treaty of Chickasaw Council House, opening it to Anglo-American settlement.
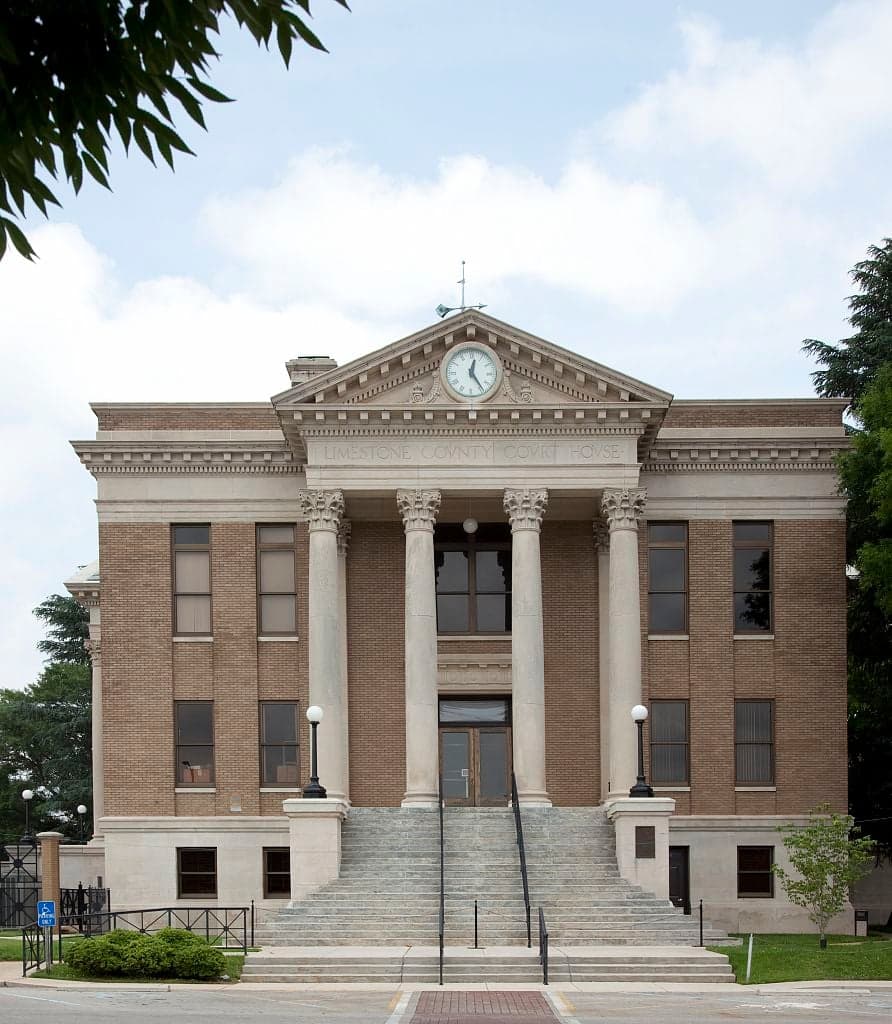
The first major wave of settlers arrived between 1810 and 1820, primarily Scots-Irish and English families migrating from Virginia, North Carolina, and Tennessee. They were drawn by the fertile black prairie soil and the promise of cotton cultivation. The town of Mooresville, founded in 1818, is the oldest incorporated town in the county and retains its antebellum character. Athens, the county seat, was established in 1818 and quickly became the commercial and political hub. These early settlers were largely small farmers, though a planter class emerged along the Tennessee River bottomlands, using enslaved Black labor to grow cotton. By 1860, enslaved people made up roughly 40% of the county’s population, a figure that would shape the post-Civil War demographic landscape.
After the Civil War and Reconstruction, the Black population remained concentrated in rural areas and in the southern part of the county, particularly around Elkmont and Ardmore. The 1870s and 1880s saw a modest influx of German and Irish immigrants, who worked on the expanding Louisville and Nashville Railroad and settled in Athens and Elkmont. These immigrants were never numerous enough to form distinct enclaves, but their descendants remain in the county today. The cotton economy persisted until the boll weevil infestation of the 1910s, which pushed many Black sharecroppers and white tenant farmers to leave during the Great Migration. The county’s population actually declined between 1910 and 1930, from 26,000 to 22,000, as agricultural mechanization reduced the need for labor.
World War II brought the first major economic shift. The Redstone Arsenal in Huntsville, established in 1941, and later the Marshall Space Flight Center, created a demand for workers that began pulling Limestone County into the Huntsville metropolitan orbit. Madison, a small town on the county’s eastern edge, started to grow as a bedroom community for Huntsville engineers. By 1960, the county’s population had recovered to 36,000, still overwhelmingly white and Black, with a tiny Hispanic and Asian presence.
Modern era (post-1965)
The 1965 Hart-Cellar Act had a minimal direct impact on Limestone County, as the foreign-born population remains only 1.8%. The county’s modern demographic story is driven by domestic migration, not immigration. The growth of Huntsville’s aerospace and defense sector—home to NASA, the U.S. Army’s Redstone Arsenal, and a growing number of defense contractors—began drawing educated professionals from across the country in the 1970s and 1980s. These new arrivals were predominantly white, but also included a small but growing number of East/Southeast Asian engineers and scientists, particularly from China, Taiwan, and Vietnam. Today, the Asian population (East/Southeast Asian) stands at 1.2%, with a separate Indian-subcontinent population at 0.6%. These communities are concentrated in the eastern part of the county, in Madison and the newer subdivisions around Greenbrier, where proximity to Huntsville jobs is highest.
The most significant demographic shift since 2000 has been the growth of the Hispanic population, which rose from 2.1% in 2000 to 7.2% today. This wave is driven by labor demand in construction, landscaping, and poultry processing, particularly at the Tyson Foods plant in Elkmont. The Hispanic community is dispersed across the county but has visible concentrations in Athens and Ardmore, where a small number of Mexican grocery stores and churches have opened. The Black population, at 12.6%, has remained relatively stable in share, though it has shifted from rural areas to the towns of Athens and Madison.
Suburbanization has been the dominant force since 1990. The county’s population grew by 35% between 2000 and 2020, driven almost entirely by the expansion of Huntsville’s suburbs. Madison has become the county’s largest city, with a population of over 50,000, and is now a majority-white, highly educated suburb with a median household income well above the county average. Athens has grown more modestly, retaining a more traditional Southern character. The unincorporated areas around Capshaw and Piney Chapel have seen new subdivisions catering to families seeking larger lots and lower taxes than Huntsville proper.
The future
Limestone County is becoming more diverse, but slowly. The Hispanic share is projected to continue rising, potentially reaching 10-12% by 2040, driven by both natural increase and continued labor migration. The East/Southeast Asian and Indian populations will likely grow as Huntsville’s tech sector expands, but they will remain small in absolute numbers. The white population, while still the majority, will see its share decline gradually as other groups grow faster. The Black population share is expected to remain stable, as outmigration to larger Southern cities is offset by some return migration.
New communities are concentrating in the eastern part of the county, particularly in Madison and the area around Greenbrier, where new schools and infrastructure are being built. The western part of the county, including Athens and Elkmont, is growing more slowly and remains more rural and less diverse. The county’s cultural identity is evolving from a quiet agricultural community to a suburban extension of Huntsville’s high-tech economy. This shift is creating some tension between longtime residents and newcomers, but the overall trend is toward a more educated, more diverse, and more economically dynamic population.
For someone moving in now, Limestone County offers a choice: the fast-growing, amenity-rich suburbs of Madison or the slower-paced, more traditional towns of Athens and Ardmore. The county is becoming more connected to the Huntsville economy, but it retains a distinct identity—lower taxes, more land, and a slightly more conservative political tilt. The future is one of steady, managed growth, with diversity increasing at a pace that does not threaten the county’s fundamental character. It is a place where the old and new South are meeting, and where the next generation will likely be more diverse and more educated than the last.

* Values derived from national, state, county, city and local statistics and may differ in a specific area. Last updated: 2026-07-03T04:28:39.000Z
Narrative content on this page is AI-generated and may contain mistakes. Verify any details that matter before acting on them.
ReloMaps may earn a commission from affiliate links at no extra cost to you.

