Photo: Wikipedia
Demographics of Torrington, CT
Affluence Level in Torrington, CT
A middle-class area roughly in line with national averages across income, home values, education, and employment.
People of Torrington, CT
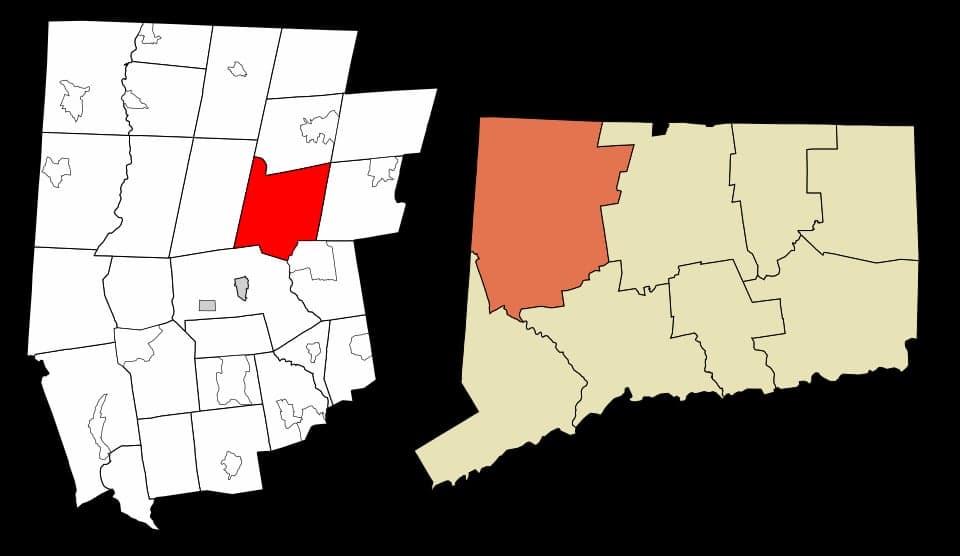
The people of Torrington, Connecticut, today number 35,481, forming a city that is notably more diverse than its rural Litchfield County surroundings yet remains predominantly white and working-class. With a foreign-born population of just 4.5%, Torrington is less of an immigrant gateway than a regional hub where native-born families, many with deep New England roots, coexist with growing Hispanic and smaller East/Southeast Asian communities. The city’s identity is shaped by its industrial past, a modest college-educated share of 24.5%, and a population density that feels suburban but with a compact, walkable downtown core.
How the city was settled and grew
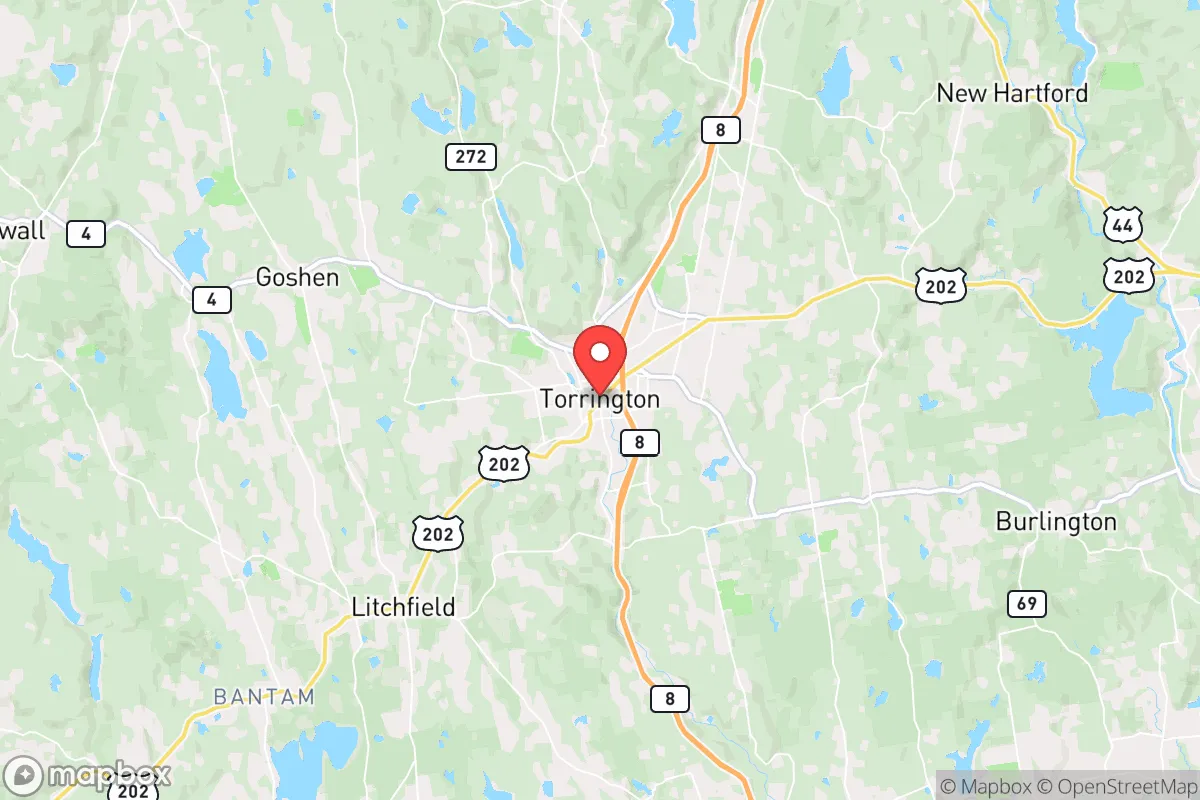
Torrington’s human history begins with European settlement in the 1730s, when English colonists from coastal Connecticut pushed inland along the Naugatuck River valley. The town was incorporated in 1740, but its population remained sparse—under 1,000—until the 19th century. The real draw was water power. The Naugatuck River’s falls fueled brass, hardware, and needle factories, and by 1850 Torrington was a booming industrial village. The first major wave of immigrants arrived from Ireland in the 1840s and 1850s, fleeing the Great Famine. They settled in the Water Street and East Main Street neighborhoods, building St. Francis of Assisi Church (1858) and forming the city’s early Catholic backbone. A second wave of French-Canadians came from Quebec between 1860 and 1900, drawn by factory jobs; they concentrated in the Torringford and West Torrington sections, establishing St. Francis Xavier parish. Italians followed heavily between 1890 and 1920, settling in the Downtown and South Main Street corridor, where they worked in the brass mills and founded the Italian Mutual Benefit Society. By 1920, Torrington’s population had surged past 20,000, and the city was incorporated in 1923. A smaller wave of Polish and Eastern European immigrants arrived in the 1910s–1930s, clustering in the Burrville neighborhood. These groups—Irish, French-Canadian, Italian, Polish—defined Torrington’s ethnic character for generations, and their descendants remain a strong presence today.
Modern era (post-1965)
The 1965 Hart-Cellar Act reshaped Torrington’s demographics, though more slowly than in larger cities. The city’s industrial base began contracting in the 1970s as brass and needle factories closed, reducing the pull for new immigrants. Domestic in-migration from other parts of Connecticut and the Northeast slowed, and Torrington’s population peaked at roughly 38,000 in 1980 before declining. The most significant post-1965 shift has been the growth of the Hispanic population, which now stands at 13.6% (about 4,800 residents). This community is predominantly Puerto Rican and Dominican, with smaller numbers from Mexico and Central America. They have settled primarily in the Downtown and East End neighborhoods, where older housing stock and rental units are more affordable. The Black population (5.8%) is concentrated in the same areas, along with a small but visible East/Southeast Asian community (2.0%, largely Vietnamese and Filipino) and an Indian-subcontinent population (0.9%). These groups have not created strongly segregated enclaves; instead, Torrington’s diversity is relatively dispersed, though Downtown and East Main Street show the highest non-white concentrations. The white population (72.6%) remains dominant across all neighborhoods, but its share has declined steadily from over 90% in 1990.
The future
Torrington’s population is slowly aging and slightly shrinking, with a median age of 42.5 years. The Hispanic community is the fastest-growing segment, driven by higher birth rates and continued in-migration from Puerto Rico and the Northeast corridor. This group is likely to reach 18–20% of the population by 2035, making Torrington more ethnically diverse but also more economically stratified, as Hispanic households have a median income roughly 30% below the city average. The East/Southeast Asian and Indian communities are small and stable, with little new immigration expected given the lack of high-skilled job growth. The white population, especially the older Italian and French-Canadian cohorts, is declining through out-migration and natural decrease. Torrington is not tribalizing into distinct ethnic enclaves; rather, it is slowly homogenizing into a lower-density, older, and more Hispanic city. The Burrville and Torringford neighborhoods remain overwhelmingly white and older, while Downtown and the East End are becoming younger and more diverse.
For someone moving in now, Torrington is becoming a more affordable, less industrial, and moderately more diverse regional hub—but one where the working-class character and small-town feel persist. The city is not a destination for high-growth immigrant communities or young professionals; it is a stable, slowly diversifying place where newcomers will find a population that is predominantly native-born, older, and rooted in its European ethnic heritage, with a growing Hispanic presence reshaping the downtown’s cultural and economic life.
* Values derived from national, state, county, city and local statistics and may differ in a specific area. Last updated: 2026-04-19T08:11:33.000Z
Narrative content on this page is AI-generated and may contain mistakes. Verify any details that matter before acting on them.
ReloMaps may earn a commission from affiliate links at no extra cost to you.