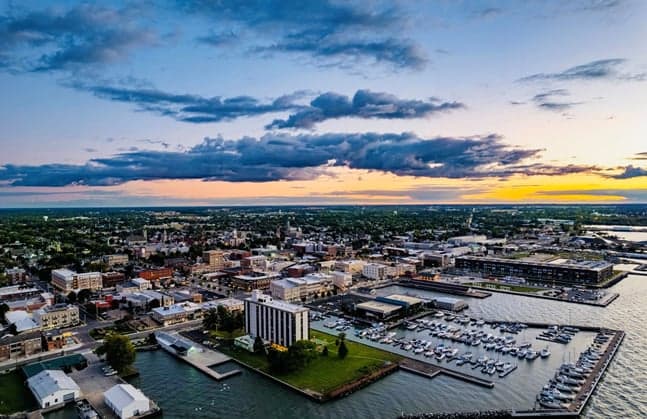
Photo: Wikipedia
Demographics of Sandusky, OH
Affluence Level in Sandusky, OH
A low-income area with significant economic hardship. Household wealth and educational attainment are well below national averages.
People of Sandusky, OH
Sandusky, Ohio, is a city of roughly 24,748 residents where the population is notably more diverse than the surrounding region, with a Black community making up 21.9% of residents and a Hispanic population at 6.2%. The city is overwhelmingly native-born — just 0.9% of residents are foreign-born — giving it a distinctly American, working-class character shaped by generations of industrial and maritime labor. With 20.5% of adults holding a college degree, Sandusky leans practical and blue-collar, a community whose identity is tied to Lake Erie, the former Cedar Point amusement park workforce, and the manufacturing plants that line the waterfront.
How the city was settled and grew
Sandusky’s population history begins with its natural harbor, which drew the first permanent European settlers in the early 1800s. The city was platted in 1818 and grew rapidly as a shipping and shipbuilding port, with the opening of the Sandusky Bay harbor and later the railroad connections making it a critical transfer point for goods and passengers heading west. The original Yankee and German settlers built the city’s earliest neighborhoods — the historic downtown district around Washington Row and the waterfront blocks near Battery Park — where the first stone and brick commercial buildings still stand today.
The major population wave came in the late 19th and early 20th centuries, driven by two forces: the iron and coal docks along the waterfront, and the rise of the passenger rail industry. This era brought a large influx of German and Irish immigrants, who settled in the working-class blocks of the West Side neighborhood, just west of the downtown core, building the modest frame houses and parish churches that still define the area. A smaller but significant wave of Eastern European immigrants, primarily Poles and Hungarians, arrived around the turn of the century to work in the foundries and the Hinde & Dauch paper company, settling in the South End near the rail yards. By 1920, Sandusky was a thriving industrial city of over 22,000, and its neighborhoods were ethnically distinct but overwhelmingly white and European.
Modern era (post-1965)
The post-1965 era brought the most significant demographic transformation in Sandusky’s history. The Great Migration of Black families from the rural South, which had been trickling into the city since the 1940s for defense and factory work, accelerated through the 1970s as the city’s auto plants and the New Departure bearing factory (later part of General Motors) actively recruited Southern labor. These families concentrated in the east side of the city, particularly the neighborhoods around Hancock Street and the Perkins Avenue corridor, where a distinct Black community established its own churches, businesses, and civic organizations. Today, the 21.9% Black share of the population is nearly triple the state average, and the community remains geographically concentrated in these east-side blocks.
Hispanic migration, now 6.2% of the population, arrived later and more gradually. Beginning in the 1980s and accelerating in the 2000s, Mexican and Puerto Rican families moved to Sandusky for seasonal work at Cedar Point and year-round jobs in the area’s food processing and logistics industries. This community is more dispersed than the Black population, with notable clusters in the west-central neighborhoods near Campbell Street and in the newer subdivisions on the city’s south edge. The East and Southeast Asian population (0.4%) and the Indian-subcontinent population (0.1%) are tiny and scattered, largely professionals employed at Firelands Regional Medical Center or the regional offices of major employers. The city’s foreign-born share of 0.9% is a fraction of the national average, reflecting that nearly all of Sandusky’s diversity is domestic in origin — the product of internal migration, not immigration.
The future
Sandusky’s population is aging and slowly shrinking, down from a peak of roughly 33,000 in the 1960s to its current 24,748. The city is becoming slightly more diverse at the margins — the Hispanic share has grown steadily over the past decade, and the small Asian and Indian populations are stable — but the overall trajectory is one of modest decline and gradual diversification rather than rapid change. The most notable demographic pressure is out-migration of young adults, who leave for Columbus, Cleveland, or other job centers, while the city attracts some in-migration from nearby rural counties drawn by lower housing costs and the Lake Erie lifestyle.
Looking ahead 10 to 20 years, Sandusky is likely to see its Hispanic population continue to grow slowly, particularly in the south-side subdivisions and the Campbell Street corridor, while the Black community remains anchored in the east side. The city’s cultural identity is evolving from its industrial-era ethnic enclaves toward a more blended, majority-minority working-class character — the combined non-white share of roughly 30% is already well above Ohio’s average. The wildcard is the continued expansion of Cedar Point and the region’s tourism economy, which could bring new service-sector jobs and, with them, new residents from outside the area.
For someone moving to Sandusky today, the city offers a genuinely diverse, working-class community with deep roots and clear neighborhood identities — a place where the east side’s Black churches, the west side’s German and Irish heritage, and the south end’s growing Hispanic presence all coexist within a few square miles. The population is stable, aging slightly, and becoming more diverse at a gradual pace, and the city’s future depends on whether it can retain its young people and attract new families to replace them. It is not a growing or dynamic city demographically, but it is a deeply rooted one, with a character shaped by a century and a half of industrial labor, lake commerce, and the distinct communities those forces built.

* Values derived from national, state, county, city and local statistics and may differ in a specific area. Last updated: 2026-10-13T01:05:46.000Z
Narrative content on this page is AI-generated and may contain mistakes. Verify any details that matter before acting on them.
ReloMaps may earn a commission from affiliate links at no extra cost to you.

