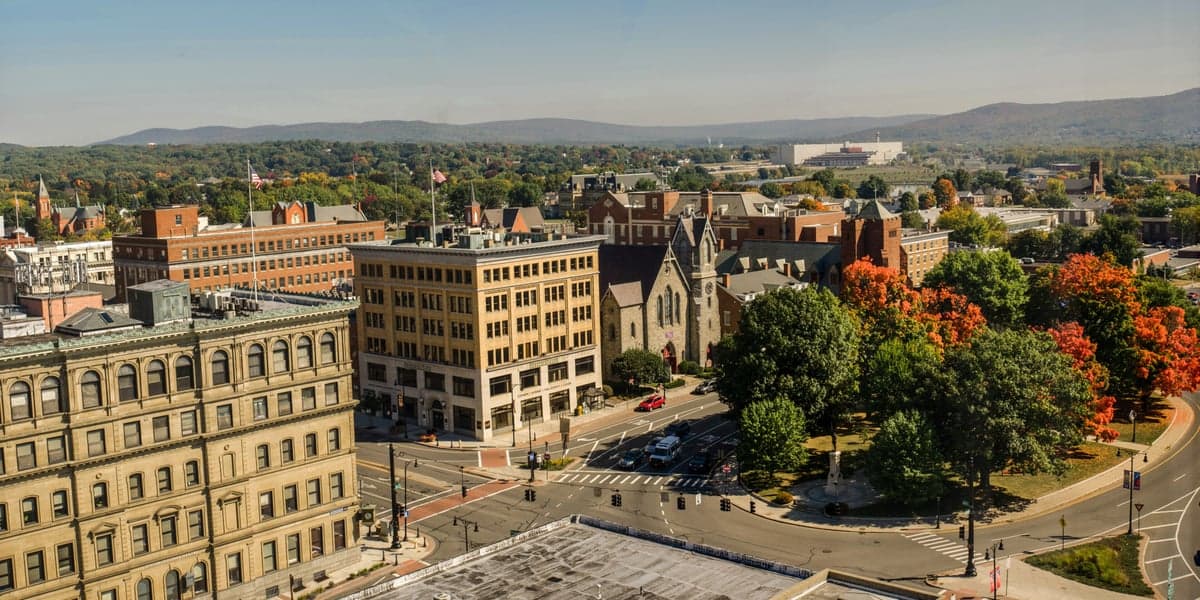
Photo: Wikipedia
Quality of Life in Pittsfield, MA
A high quality of life with strong walkability, manageable living costs, healthy neighborhood signals, and solid amenity access.
What does Quality of Life tell us?
Quality of Life blends cost of living, nearby amenities, socioeconomic signals, and neighborhood character. City-level scores represent the whole municipality; individual neighborhoods can differ.
What does this tell us?
Quality of Life blends cost of living, nearby amenities, socioeconomic signals, and neighborhood character. City-level scores represent the whole municipality; individual neighborhoods can differ.
Cost of Living
10% below national average
The Real Cost of Living in Pittsfield, MA for 2026
| Tier | Individual | Family (4) |
|---|---|---|
| Survival | $17k | $33k |
| Comfortable | $45k | $67k |
| Luxury | $124k+ | $191k+ |
| Elite (Top 5%) | $159k+ | $247k+ |
102%
The Area Signal
A metric tracking the socioeconomic signals of the area.
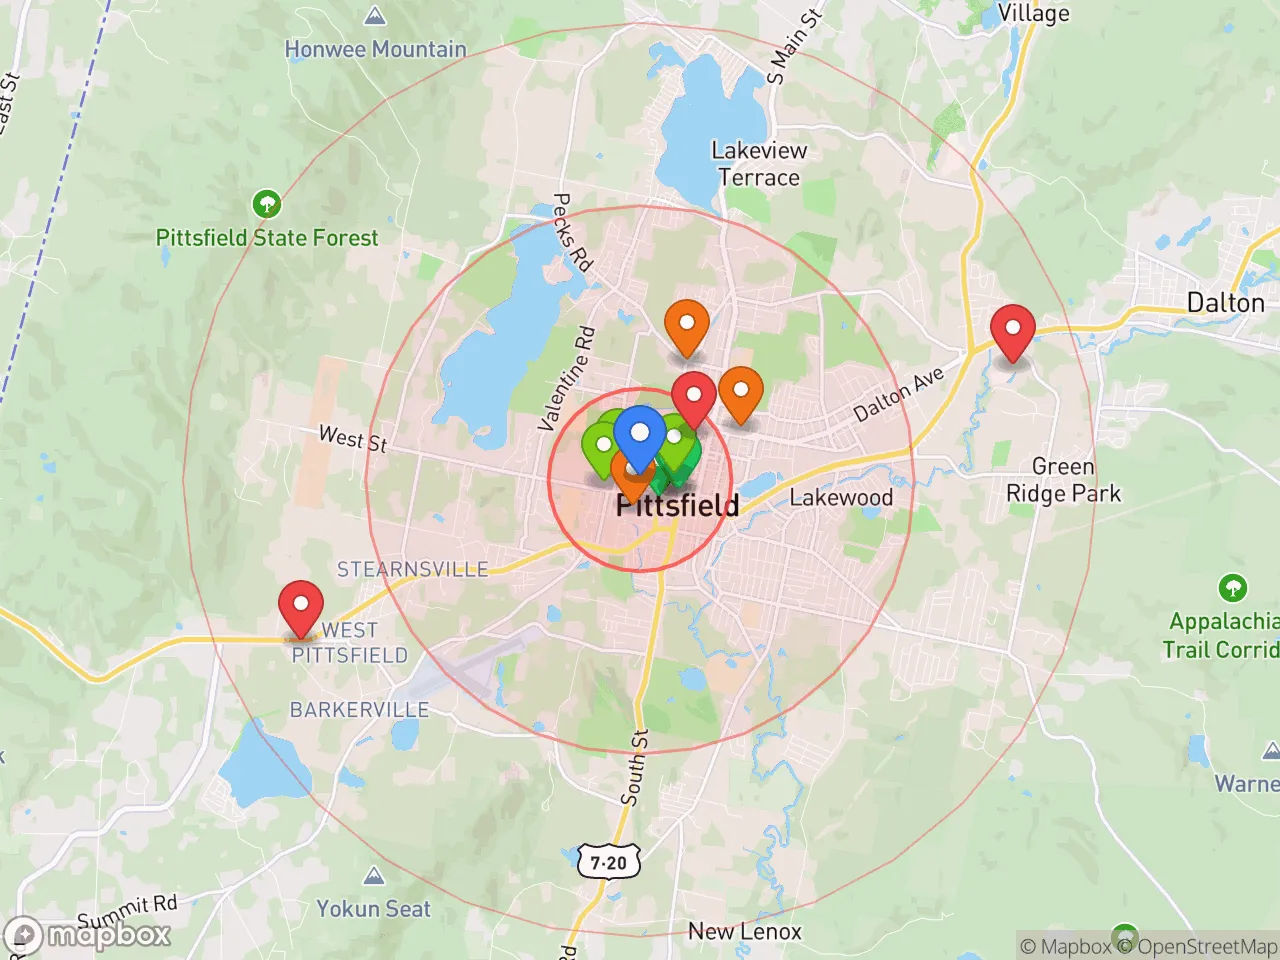
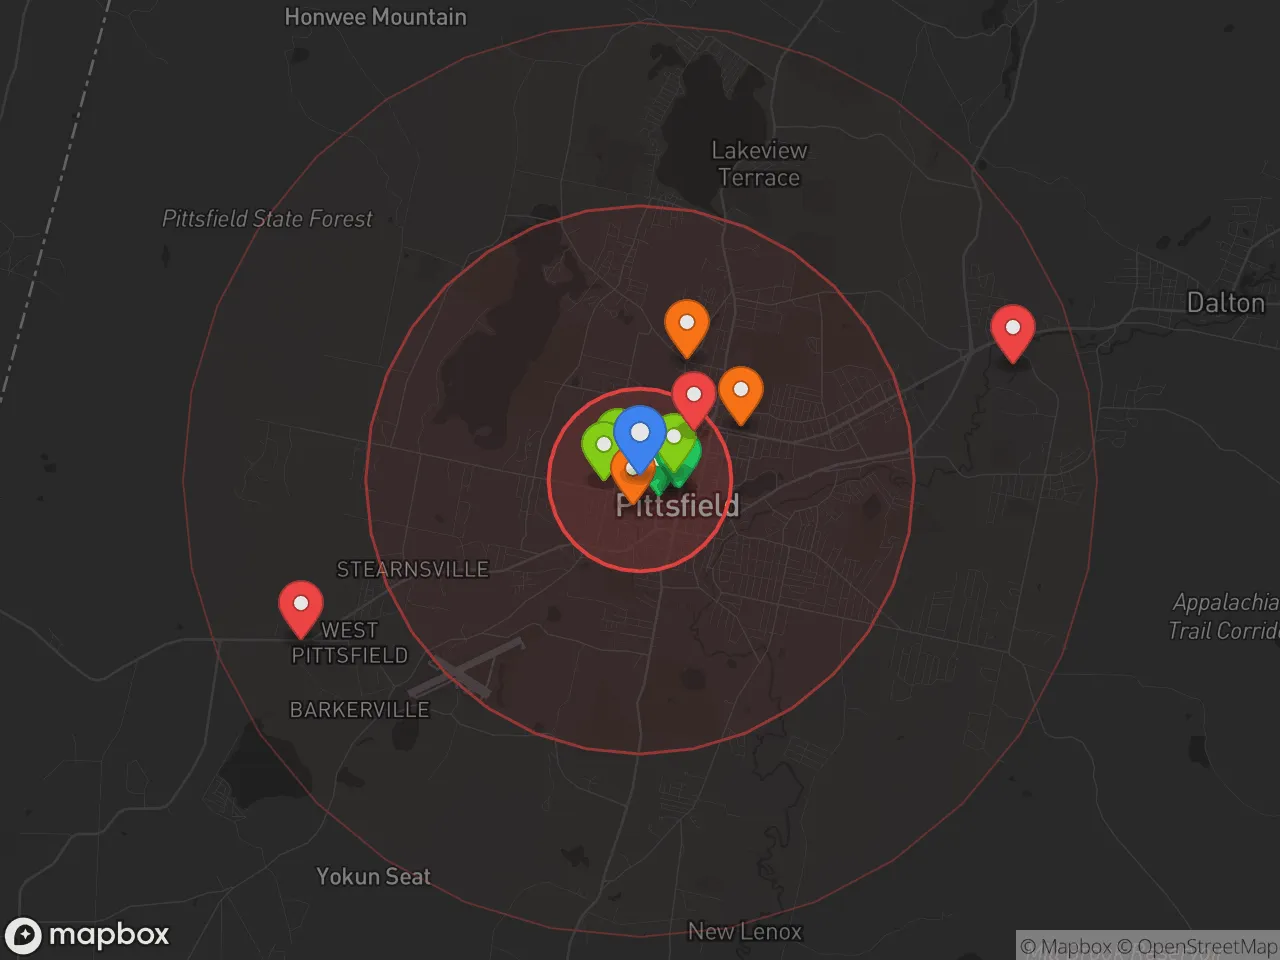
Hobbies
Explore the areaGroceries
7 within 10 miles
Gas
9 within 10 miles
Hospital
4 within 20 miles
Airport
JFK — John F. Kennedy International
Post Office
USPS — Pittsfield, MA
Critical Amenities
Quality-of-Life Analysis
Pittsfield, Massachusetts, offers a quality of life defined by modest affluence and a strong sense of community, attracting a mix of long-term residents, young families, and professionals seeking a slower pace within striking distance of the Berkshires' cultural assets. The city's cost of living index of 90 (where 100 equals the U.S. average) makes it notably more affordable than the Boston metro area or nearby Albany, yet it supports a population that values the area's historic architecture, outdoor recreation, and a tight-knit social fabric. While not a wealthy enclave like some neighboring towns, Pittsfield provides a grounded, accessible lifestyle for those who prioritize space and nature over urban amenities.
Cost of living and housing affordability compared to the Berkshires
Pittsfield's housing market is a standout feature for affordability in western Massachusetts. The median home value sits at $233,700, significantly lower than the state median of roughly $500,000 and well below the $350,000+ averages found in nearby Lenox or Stockbridge. Median rent is $1,094, which undercuts the national average and makes the city a practical choice for renters who might otherwise be priced out of the region. The average commute is just 18 minutes, a fraction of the 30+ minute drives common in suburban Boston or the Capital Region, meaning residents save both time and transportation costs. Property taxes in Berkshire County hover around 1.3% of assessed value, which is moderate for Massachusetts and contributes to the overall affordability equation. For buyers, the trade-off is that Pittsfield's housing stock is older—many homes date to the 19th and early 20th centuries—so renovation costs and energy efficiency should be factored into budgets.
What daily life is like for families and professionals
Daily life in Pittsfield revolves around a compact downtown core, the sprawling Pittsfield State Forest, and a calendar of cultural events anchored by the Berkshire Museum and Barrington Stage Company. The Pittsfield Public Schools system includes Taconic High School and Pittsfield High School, both of which offer vocational and college-prep tracks, though some families opt for private options like the co-ed Miss Hall's School or the all-boys Berkshire School in nearby Sheffield. Groceries, dining, and retail are concentrated along North Street and the Berkshire Mall corridor, with a farmers' market operating seasonally at the First Street Common. The city's 18-minute average commute means most residents can reach work, school, or errands quickly, leaving more time for hiking the Appalachian Trail access points at October Mountain State Forest or skiing at Jiminy Peak. Healthcare is well-served by Berkshire Medical Center, a Level III trauma center that anchors the region's medical services. The rhythm here is slower than in Boston or New York, but the presence of Tanglewood (summer home of the Boston Symphony Orchestra) and the Williamstown Theatre Festival ensures a steady stream of high-caliber arts within a 20-minute drive.
Pittsfield is best suited for those who value affordability, outdoor access, and cultural richness over urban nightlife or career density. Families on a budget, remote workers, and retirees will find the low commute times and reasonable housing costs compelling, while professionals in healthcare, education, or the arts will appreciate the local employment base. The city's demographic tilt leans older and more settled than the national average, so newcomers seeking a vibrant singles scene or fast-paced career growth may find it limiting. However, for anyone who wants a home base in the Berkshires without the premium price tag of the tourist towns, Pittsfield delivers a grounded, livable quality of life that few Massachusetts cities can match at this price point.
Crime in Pittsfield, MA
Crime rates similar to the national median for U.S. locations.
Violent CrimeViolent Crime Analysis
Property CrimeProperty Crime Analysis
Crime Analysis
Pittsfield, Massachusetts, reports a violent crime rate of 554.2 incidents per 100,000 residents and a property crime rate of 868.6 per 100,000, figures that place it among the higher-risk communities in Berkshire County. While not as dangerous as the most violent cities in the state, the city's crime statistics warrant careful consideration for anyone evaluating a move to the area. The overall safety picture is one of elevated risk relative to both state and national averages, driven in part by the broader criminal justice environment in Massachusetts.
Crime in context
Pittsfield's violent crime rate is roughly 1.5 times the national average and significantly higher than the Massachusetts state average of approximately 300 per 100,000. Property crime, while lower than violent crime in raw numbers, still exceeds the state median. These figures place Pittsfield in a challenging position: it is the largest city in Berkshire County, but its crime rates are more comparable to smaller, struggling post-industrial cities in the region than to safer suburban towns like Lenox or Stockbridge. The city's location within a state known for progressive district attorneys and lenient sentencing policies is a contributing factor, as these judicial philosophies often result in reduced incarceration rates and quicker return of offenders to the community, directly impacting public safety.
What residents experience
Residents report that property crime—particularly theft from vehicles, burglary, and vandalism—is the most common safety concern in daily life. The 868.6 property crime rate translates to roughly 2.4 incidents per day across the city. Violent crime, while less frequent, includes aggravated assault as the most common category, with robbery and rape occurring at lower but still notable rates. Drug-related offenses and associated violence are persistent issues, concentrated in specific neighborhoods and often linked to the region's opioid crisis. Many residents adjust their routines by avoiding certain areas after dark, securing vehicles and homes meticulously, and staying informed through neighborhood watch groups and local police social media updates.
Neighborhood-level variation
Safety in Pittsfield is not uniform. The downtown core and areas near the Pittsfield Common see higher concentrations of both property and violent crime, particularly around bar closing times and near public housing complexes. West Side and Morningside neighborhoods generally report lower crime rates, while the North End and sections of the South Side experience more frequent incidents. The city's police department has implemented community policing initiatives and targeted patrols in high-crime zones, but the underlying challenges of poverty, substance abuse, and a justice system that prioritizes rehabilitation over incarceration continue to shape the safety landscape. Prospective residents should research specific street-level data and visit neighborhoods at different times of day to form a complete picture.
* Values derived from national, state, county, city and local statistics and may differ in a specific area. Last updated: 2026-04-24T08:07:05.000Z
Narrative content on this page is AI-generated and may contain mistakes. Verify any details that matter before acting on them.
ReloMaps may earn a commission from affiliate links at no extra cost to you.