Photo: Wikipedia
Demographics of New Market, VA
Affluence Level in New Market, VA
A below-average socioeconomic profile. Incomes, home values, and educational attainment trail the U.S., with higher poverty and unemployment.
People of New Market, VA
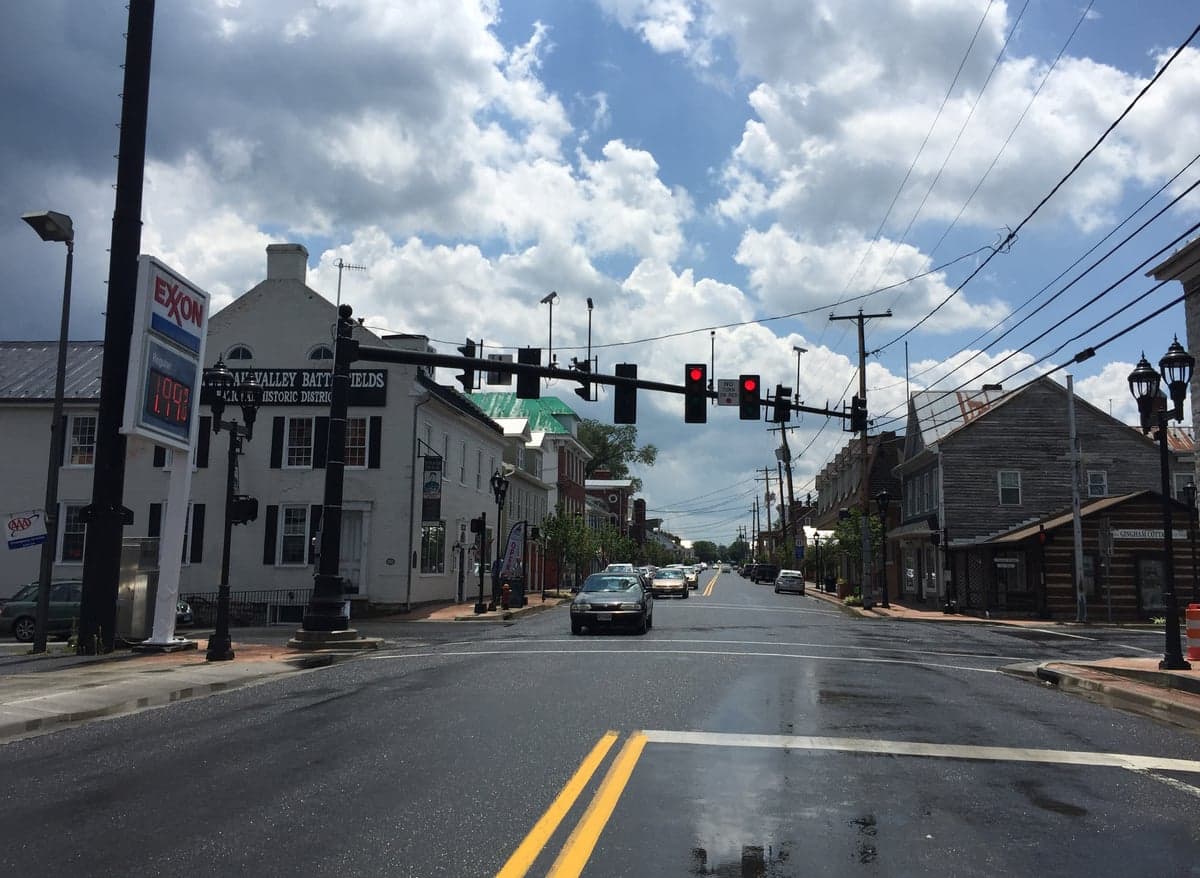
New Market, Virginia, is a small town of 2,159 residents where the population is overwhelmingly white (86.1%) and native-born, with a foreign-born share of just 0.9%. The town’s identity is rooted in its Shenandoah Valley agricultural heritage and its role as a Civil War battlefield, but its modern character is increasingly shaped by Hispanic residents (7.7%) and a small Black community (4.4%). Unlike many Virginia towns, New Market has not experienced significant suburban sprawl, retaining a tight-knit, historically grounded population that is slowly diversifying along specific corridors.
How the city was settled and grew
New Market was founded in the 1760s as a trading post along the Great Wagon Road, a major migration route that brought Scots-Irish and German settlers down the Shenandoah Valley. These original settlers were primarily subsistence farmers and craftsmen, drawn by fertile limestone soil and land grants from Lord Fairfax. The town’s historic core, centered around the intersection of Congress Street and Old Cross Road, was built by these German and Scots-Irish families, who erected the stone and brick structures that still define the downtown district today. The 1862 Battle of New Market, fought largely on the hills south of town, cemented the area’s identity, and the postwar period saw a slow recovery led by the same founding families who remained dominant into the early 20th century.
Through the mid-1900s, New Market’s population was almost entirely white, with a small number of Black families concentrated in the area near the old railroad tracks on the eastern edge of town, a neighborhood sometimes referred to locally as the "Bottom." The town’s growth was modest, driven by the agricultural economy, the presence of the Shenandoah Valley Railroad, and later, the establishment of the New Market Battlefield State Historical Park in the 1960s, which brought a modest tourism economy but no major population influx.
Modern era (post-1965)
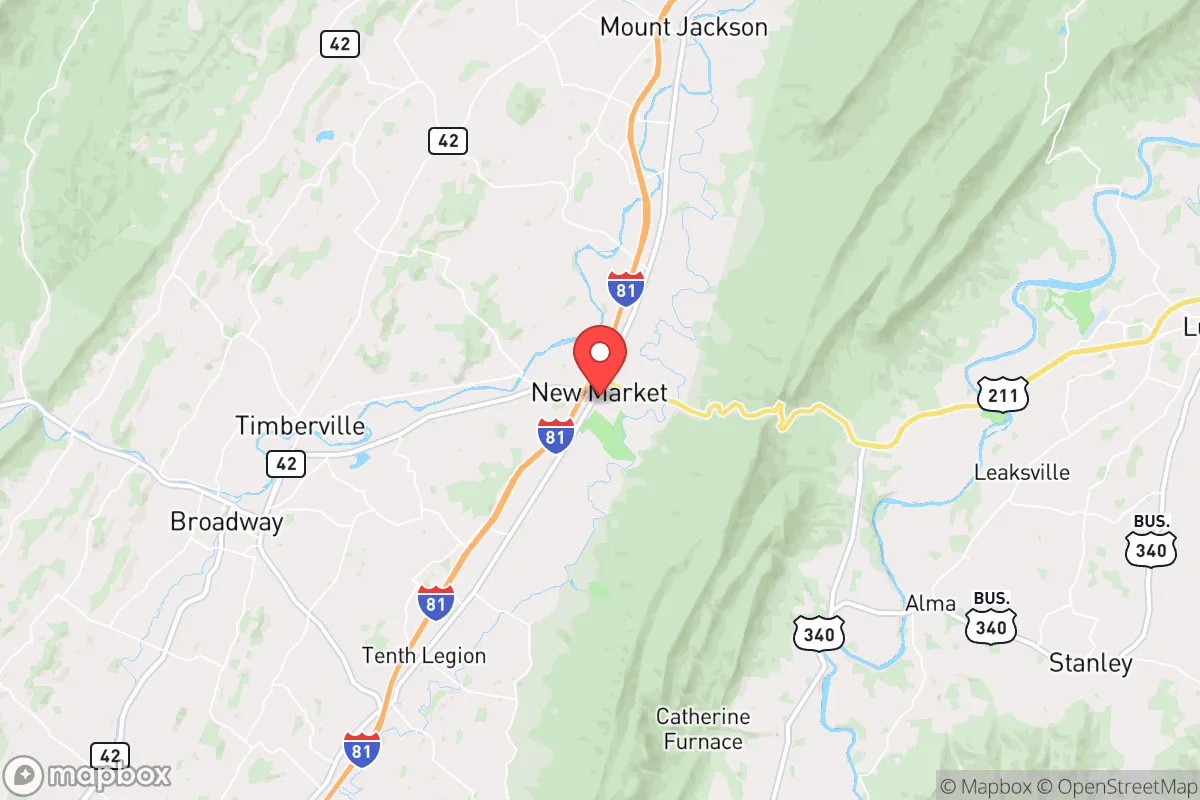
The post-1965 period brought only gradual demographic change to New Market. The Immigration and Nationality Act of 1965 had minimal direct impact here; the foreign-born population remains under 1%. Instead, the most significant shift has been the growth of the Hispanic community, which now stands at 7.7% of the population. This growth is largely tied to agricultural labor in the surrounding apple orchards and poultry operations in nearby Rockingham County. Hispanic families have concentrated in the rental housing stock along Route 211 west of downtown, an area of modest single-family homes and mobile home parks that has become the town’s most diverse corridor.
Domestic in-migration has been modest but steady, driven by retirees and remote workers seeking lower housing costs and proximity to the Shenandoah National Park. These newcomers have largely settled in newer subdivisions on the town’s northern edge, such as the small developments off Old Cross Road, which feature larger lots and a more suburban character than the historic core. The Black population, at 4.4%, remains small and is dispersed rather than concentrated, with families living throughout the older sections of town rather than in a single distinct neighborhood. The East/Southeast Asian population is minimal at 0.5%, and there is no measurable Indian-subcontinent population, reflecting the town’s limited draw for professional or tech-driven migration.
The future
New Market’s population is slowly becoming more diverse, but the pace is glacial. The Hispanic share is the only demographic segment projected to grow meaningfully, driven by continued agricultural employment and family reunification. This growth is likely to remain concentrated in the Route 211 corridor, where affordable housing and proximity to farm work anchor the community. The white population, while still dominant, is aging, and the town faces the challenge of retaining younger residents, many of whom leave for larger employment centers like Harrisonburg (15 miles south) or Winchester (30 miles north).
Over the next 10-20 years, New Market is unlikely to see dramatic demographic transformation. The college-educated share is just 20.2%, limiting the town’s appeal to knowledge-economy migrants. However, the continued popularity of the Shenandoah Valley as a retirement destination and the expansion of remote work could bring a slow trickle of new residents to the northern subdivisions. The town’s cultural identity is likely to remain rooted in its Civil War heritage and agricultural traditions, with the Hispanic community gradually becoming a more visible and integrated part of the social fabric.
For someone moving to New Market today, the town offers a stable, historically rich environment with a population that is overwhelmingly native-born and white, but with a growing Hispanic presence that is beginning to reshape the town’s cultural landscape. The housing stock is a mix of historic homes in the downtown core and newer developments on the outskirts, with the Route 211 corridor serving as the most affordable and diverse entry point. This is not a town undergoing rapid change; it is a place where demographic shifts happen slowly, and where newcomers—whether from nearby counties or from Latin America—are absorbed into a community that values its past while gradually accommodating a more varied future.

* Values derived from national, state, county, city and local statistics and may differ in a specific area. Last updated: 2026-11-02T05:08:37.000Z
Narrative content on this page is AI-generated and may contain mistakes. Verify any details that matter before acting on them.
ReloMaps may earn a commission from affiliate links at no extra cost to you.

