Photo: Wikipedia
Demographics of Nevada City, CA
Affluence Level in Nevada City, CA
An upper-middle-class area. Household wealth, education levels, and homeownership run ahead of national benchmarks.
People of Nevada City, CA
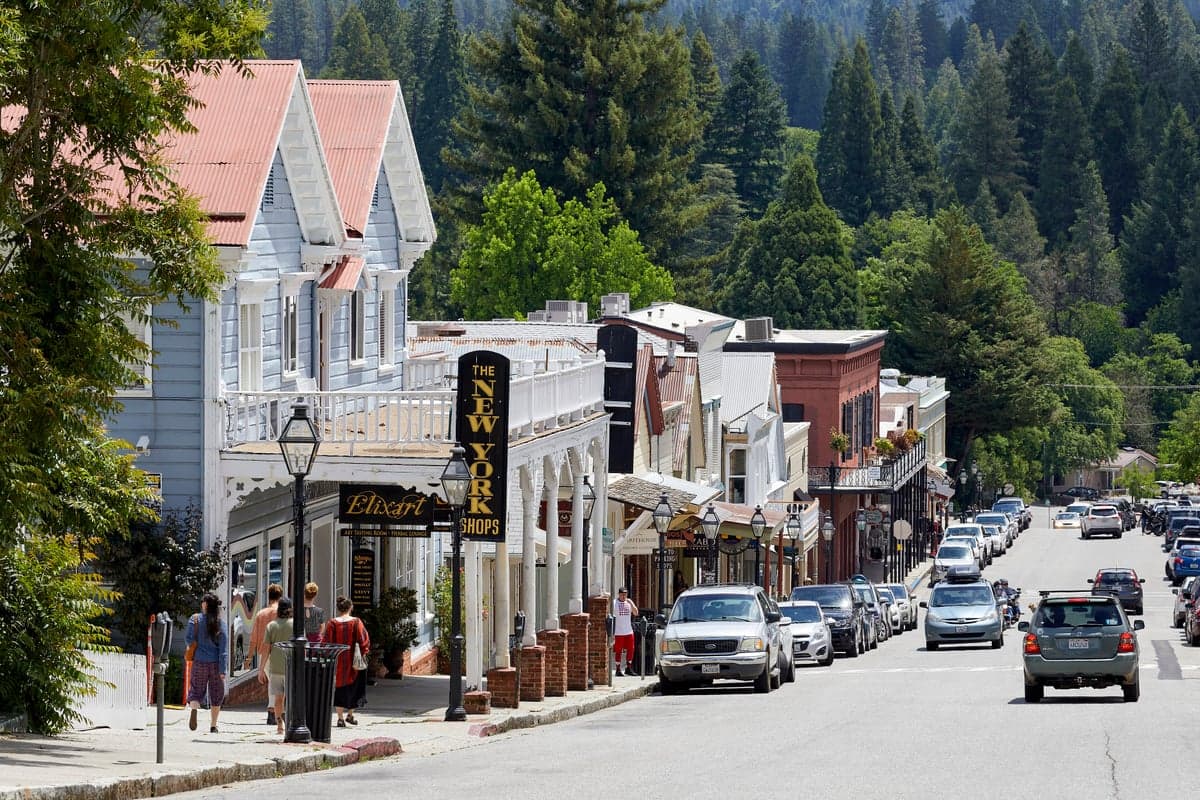
The people of Nevada City, California, today number 3,168 residents, forming a community that is notably older and more educated than the national average, with 39.0% holding a college degree. The population is overwhelmingly White (91.1%), with a small Hispanic presence (2.5%) and minimal representation from Black (0.4%) or East/Southeast Asian (0.7%) communities. The foreign-born share sits at just 6.4%, well below the California state average, reflecting a city shaped more by domestic in-migration than international immigration. This is a place with a strong sense of historical continuity, where the cultural identity is rooted in the Gold Rush era, a later wave of countercultural settlement, and a present-day draw for those seeking a small-town, nature-oriented lifestyle.
How the city was settled and grew
Nevada City was born in the California Gold Rush of 1849, when prospectors flooded the Sierra Nevada foothills. The original population was overwhelmingly male, transient, and drawn from a mix of Anglo-American migrants, European immigrants (especially Cornish miners, Irish laborers, and German merchants), and a significant number of Chinese miners who arrived after 1850. The Chinese community, though small, was concentrated in what was then called China Town, a district along lower Broad Street near the creek, where they worked placer claims and later operated laundries and gardens. As hard-rock mining replaced placer operations, the Cornish—known for their mining expertise—settled in the Banner Mountain area and the Piety Hill neighborhood, building the Methodist and Catholic churches that still stand. By the 1870s, the city had stabilized as a commercial and government hub for Nevada County, with a population that was largely native-born White, with a small but persistent Chinese enclave. The decline of mining after 1900 led to a long period of stagnation; the population hovered around 2,500 for decades, and the city became a quiet, insular mountain town.
Modern era (post-1965)
The 1965 Immigration and Nationality Act had little direct effect on Nevada City, as the city did not attract the post-1965 waves of Asian or Latin American immigration that transformed coastal California. Instead, the major demographic shift came from domestic in-migration during the 1970s and 1980s, when a countercultural "back-to-the-land" movement drew artists, musicians, and spiritual seekers to the area. These newcomers—predominantly White, college-educated, and politically liberal—settled in the Deer Creek area and the hillside neighborhoods west of downtown, such as South Yuba River Canyon properties, where they established communes, organic farms, and alternative schools. This wave transformed the city's cultural identity, introducing a bohemian and environmentalist ethos that coexists uneasily with the older, more conservative ranching and logging families. The 1990s and 2000s saw a second wave of domestic migration: affluent retirees and remote workers from the San Francisco Bay Area, drawn by the historic architecture, lower housing costs (relative to the Bay), and outdoor recreation. These newcomers concentrated in the Historic District (the core downtown grid) and the Seven Hills subdivision, a planned community of larger homes on the city's eastern edge. The result is a city that is more educated and wealthier than the surrounding county, but also less diverse: the Hispanic share has remained flat at around 2.5% since 2000, and the Black population is negligible.
The future
Nevada City's population is projected to grow slowly, if at all, constrained by limited developable land, strict zoning, and a housing stock that is increasingly expensive. The city is becoming less diverse in relative terms, as the White, college-educated share continues to rise while younger, more diverse families are priced out and move to more affordable towns like Grass Valley or Penn Valley. The East/Southeast Asian and Indian-subcontinent populations remain tiny (0.7% and 0.0%, respectively), and there is no sign of a significant influx from these groups. The most likely demographic trend is continued "affluent in-fill": Bay Area telecommuters and retirees buying existing homes, particularly in the Historic District and Banner Mountain neighborhoods, while younger locals and service workers are displaced. The cultural identity will likely remain a blend of Gold Rush heritage and countercultural environmentalism, but with an increasingly wealthy and older tilt. The city may see modest growth in the Hispanic population if service-sector jobs expand, but this will be concentrated in the unincorporated areas outside city limits rather than within Nevada City proper.
For someone moving in now, Nevada City offers a stable, safe, and culturally rich small-town environment with a strong sense of place. The trade-off is clear: you are joining a community that is demographically homogeneous and becoming more so, where housing costs are high relative to local wages, and where the population skews older and more educated than the national average. This is not a place of rapid change or growing diversity—it is a place that has found its character and is carefully preserving it.

* Values derived from national, state, county, city and local statistics and may differ in a specific area. Last updated: 2026-09-22T20:11:04.000Z
Narrative content on this page is AI-generated and may contain mistakes. Verify any details that matter before acting on them.
ReloMaps may earn a commission from affiliate links at no extra cost to you.

