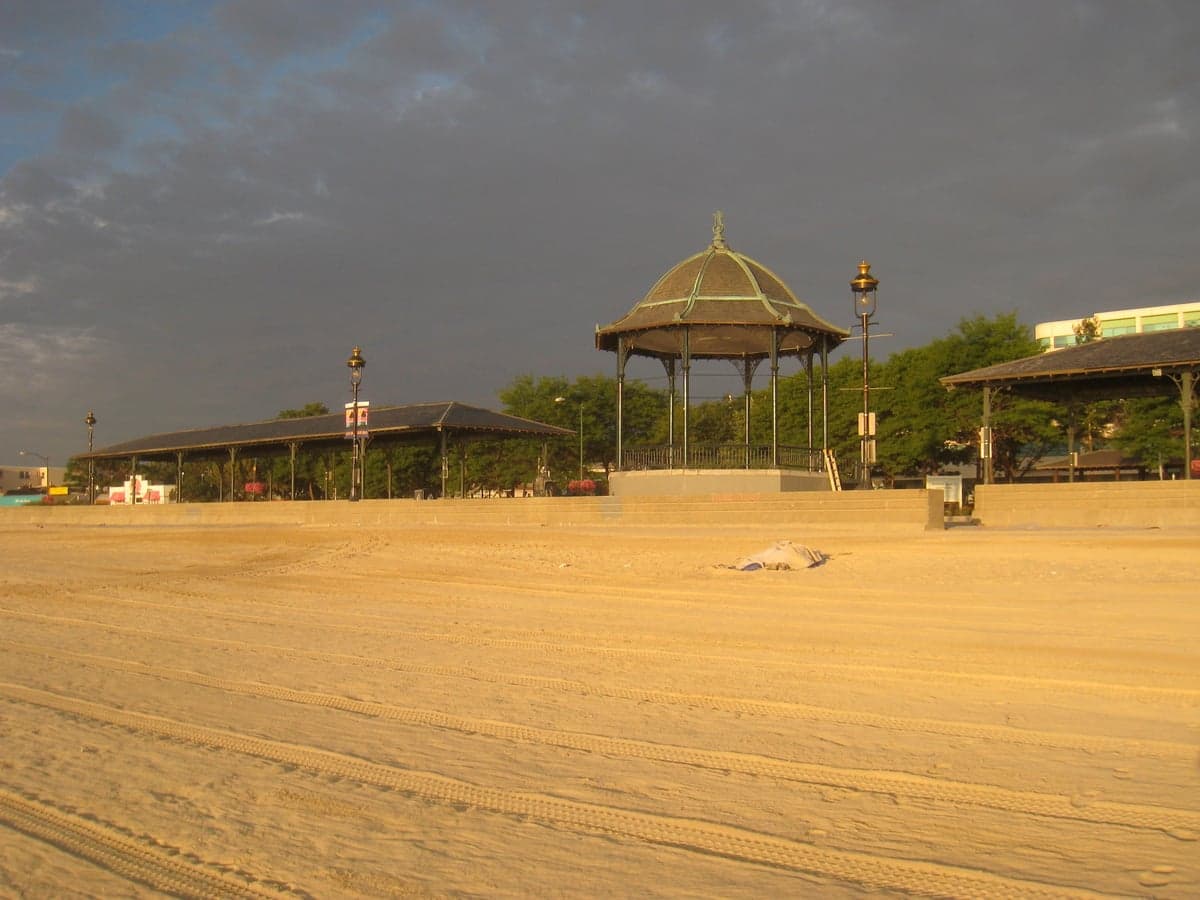
Photo: Wikipedia
Quality of Life in Suffolk County
A livable area that tracks near national norms for affordability, walkability, and neighborhood health.
What does Quality of Life tell us?
Quality of Life measures an area by evaluating factors like cost of living, nearby amenities, country club access, airport proximity, socioeconomic signals and neighborhood character. For large states, this is a general average — quality of life can vary dramatically between metro areas, suburbs, and rural communities within the same state.
What does this tell us?
Quality of Life measures an area by evaluating factors like cost of living, nearby amenities, country club access, airport proximity, socioeconomic signals and neighborhood character. For large states, this is a general average — quality of life can vary dramatically between metro areas, suburbs, and rural communities within the same state.
Cost of Living
103% above national average
48%
The Real Cost of Living in Suffolk County for 2026
| Tier | Individual | Family (4) |
|---|---|---|
| Survival | $33k | $62k |
| Comfortable | $132k | $194k |
| Luxury | $168k+ | $260k+ |
| Elite (Top 5%) | $240k+ | $371k+ |
Quality-of-Life Analysis
Suffolk County, Massachusetts, is a dense, urban county that encompasses the city of Boston and its inner-ring suburbs, offering a quality-of-life spectrum that ranges from the high-energy core of a global city to quieter, more residential neighborhoods with distinct local identities. The county is overwhelmingly urban and suburban, with no true rural pockets, but the character of daily life shifts dramatically between the bustling downtown districts and the tree-lined streets of its smaller communities. People drawn to Suffolk County typically seek either the career opportunities and cultural density of a major metropolis or the family-oriented stability and historic charm of established neighborhoods within easy reach of Boston.
Largest town(s) & population centers
Boston is the dominant population center of Suffolk County, comprising the vast majority of the county's land and population. Daily life in Boston varies significantly by neighborhood: in the Back Bay and Beacon Hill, residents navigate historic brownstones, high-end boutiques, and a constant flow of professionals and tourists. In South Boston and Charlestown, a mix of young professionals and long-time families fills renovated row houses and waterfront parks. Dorchester and Roxbury offer more diverse, community-oriented living with a strong sense of local identity and more affordable housing options within the city. The average commute across the county is approximately 31 minutes, a figure heavily influenced by Boston's extensive subway (MBTA) and bus network, which makes car-free living feasible for many residents in these core neighborhoods. The city's economy is anchored by finance, healthcare (with major employers like Mass General Brigham and Boston Children's Hospital), higher education (Harvard, MIT, Boston University), and a thriving biotech sector in the Seaport District.
Smaller towns & rural pockets
Suffolk County contains no rural areas; it is the most densely populated county in Massachusetts. However, the county does include three smaller, independent cities that function as distinct communities with their own downtowns and residential character. Revere, located north of Boston, offers a more affordable, beachside lifestyle along Revere Beach, with a large immigrant community and a growing number of new apartment buildings. Chelsea, directly across the Mystic River from Boston, is a densely populated, working-class city with a strong Latino heritage and a rapidly developing downtown area near the new Suffolk Downs redevelopment. Winthrop, a peninsula jutting into Boston Harbor, provides a quieter, small-town feel with excellent water views, a tight-knit community, and a slower pace than its larger neighbors, while still being a 15-minute drive from downtown Boston. These three cities offer a more residential, less tourist-driven experience than Boston proper.
Cost & lifestyle range
The cost of living in Suffolk County is exceptionally high, with a cost-of-living index of 203 (more than double the national average). The median home value is $680,700, and median rent is $2,069, though these figures mask wide variation. At the high end, neighborhoods like Back Bay and Beacon Hill command median home prices well over $1 million, with luxury condos and historic townhouses. At the more accessible end of the spectrum, Revere and Chelsea offer median home values closer to $500,000–$600,000, though still far above national averages. Lifestyle differences are stark: a resident in Winthrop might enjoy a quiet evening walk along the harbor and a commute via the Blue Line, while a resident in Downtown Boston lives amid constant activity, world-class dining, and a short walk to work. The county's public transit system is a great equalizer, allowing those in less central neighborhoods to access Boston's jobs and amenities without a car, though commute times can stretch beyond 45 minutes for those living in the outer parts of the county.
Suffolk County is best suited for individuals and families who prioritize urban access, career density, and cultural vibrancy over space, quiet, or low cost. Professionals in finance, tech, healthcare, and academia thrive here, as do students attending the dozens of colleges and universities within the county. Families who choose Suffolk County often settle in neighborhoods like West Roxbury or Jamaica Plain within Boston, or in the smaller cities of Winthrop and Revere, where they can find more space and community while remaining connected to the city. Those seeking a rural or low-cost lifestyle would need to look outside the county entirely, but for those who embrace its dense, dynamic character, Suffolk County offers an unmatched concentration of opportunity and experience.

Crime in Suffolk County
Generally safer than 71% of comparable U.S. locations.
Violent CrimeViolent Crime Analysis
Property CrimeProperty Crime Analysis
Crime Analysis
Suffolk County, Massachusetts, which encompasses Boston, Chelsea, Revere, and Winthrop, presents a complex safety picture shaped by its dense urban core and progressive criminal justice policies. The county's violent crime rate stands at 235.8 incidents per 100,000 residents, while property crime occurs at a rate of 813.5 per 100,000. These figures place Suffolk County above both the Massachusetts state average and national benchmarks, driven largely by the high-density challenges of Boston and the socioeconomic pressures in Chelsea and Revere. The Suffolk County District Attorney's Office, led by Kevin Hayden, operates under a progressive framework that emphasizes diversion programs and reduced incarceration for non-violent offenders—a philosophy that, while aimed at reducing recidivism, has drawn criticism for potentially emboldening repeat offenders and undermining public confidence in the justice system.
Crime in context
When compared to statewide data, Suffolk County's violent crime rate is roughly 60% higher than the Massachusetts average of approximately 147 per 100,000, and its property crime rate exceeds the state norm by about 30%. Nationally, the county's violent crime rate is slightly below the U.S. average of roughly 380 per 100,000, but property crime is notably higher than the national figure of around 1,950 per 100,000. The disparity within Suffolk County is stark: Boston's downtown and South End neighborhoods see elevated rates of theft and assault, while Chelsea—a small, densely packed city of about 40,000—reports violent crime rates that can exceed 400 per 100,000 in some years. Revere and Winthrop, by contrast, experience lower crime rates, with Winthrop often recording violent crime below 150 per 100,000. The progressive policies of the Suffolk County DA's office, including a presumption against cash bail for many non-violent offenses and a focus on restorative justice, have been linked to higher recidivism rates in some analyses, as offenders face fewer immediate consequences for property crimes like shoplifting and car break-ins.
What residents experience
For those living in Suffolk County, daily safety concerns vary dramatically by neighborhood. In Boston's Roxbury and Dorchester, residents frequently report gun violence and gang-related activity, with these areas accounting for a disproportionate share of the county's homicides. Property crime is a near-universal annoyance: car break-ins and package thefts are common in Back Bay and the South End, while bicycle thefts plague Cambridge-adjacent areas. In Chelsea, residents contend with high rates of larceny and motor vehicle theft, often tied to organized retail crime rings that exploit the city's proximity to major highways. The progressive judicial approach means that many property crime offenders are released on summons rather than held, leading to a perception among residents that the system prioritizes offender rehabilitation over victim restitution. For example, a 2025 Boston Globe investigation found that nearly 40% of individuals arrested for larceny in Suffolk County were rearrested within six months, a figure critics attribute to lenient pretrial release conditions.
Neighborhood-level variation is pronounced. The safest areas within Suffolk County include Winthrop, a coastal town with a violent crime rate near 100 per 100,000, and Boston's affluent Beacon Hill and Charlestown neighborhoods, where property crime is the primary concern. Conversely, the most dangerous areas are concentrated in Boston's Mattapan and Roxbury, where violent crime rates can exceed 600 per 100,000, and in Chelsea, where the combination of poverty, dense housing, and limited police resources creates persistent safety challenges. Residents in these higher-crime areas often express frustration with the Suffolk County DA's office, arguing that progressive policies—while well-intentioned—fail to address the root causes of crime and leave law-abiding citizens vulnerable to repeat offenders. For those considering relocation, a careful neighborhood-by-neighborhood assessment is essential, as the county's overall statistics mask significant disparities in daily safety.
* Values derived from national, state, county, city and local statistics and may differ in a specific area. Last updated: 2026-06-18T10:33:47.000Z
Narrative content on this page is AI-generated and may contain mistakes. Verify any details that matter before acting on them.
ReloMaps may earn a commission from affiliate links at no extra cost to you.

