Photo: Wikipedia
Demographics of Lyndonville, VT
Affluence Level in Lyndonville, VT
A below-average socioeconomic profile. Incomes, home values, and educational attainment trail the U.S., with higher poverty and unemployment.
People of Lyndonville, VT
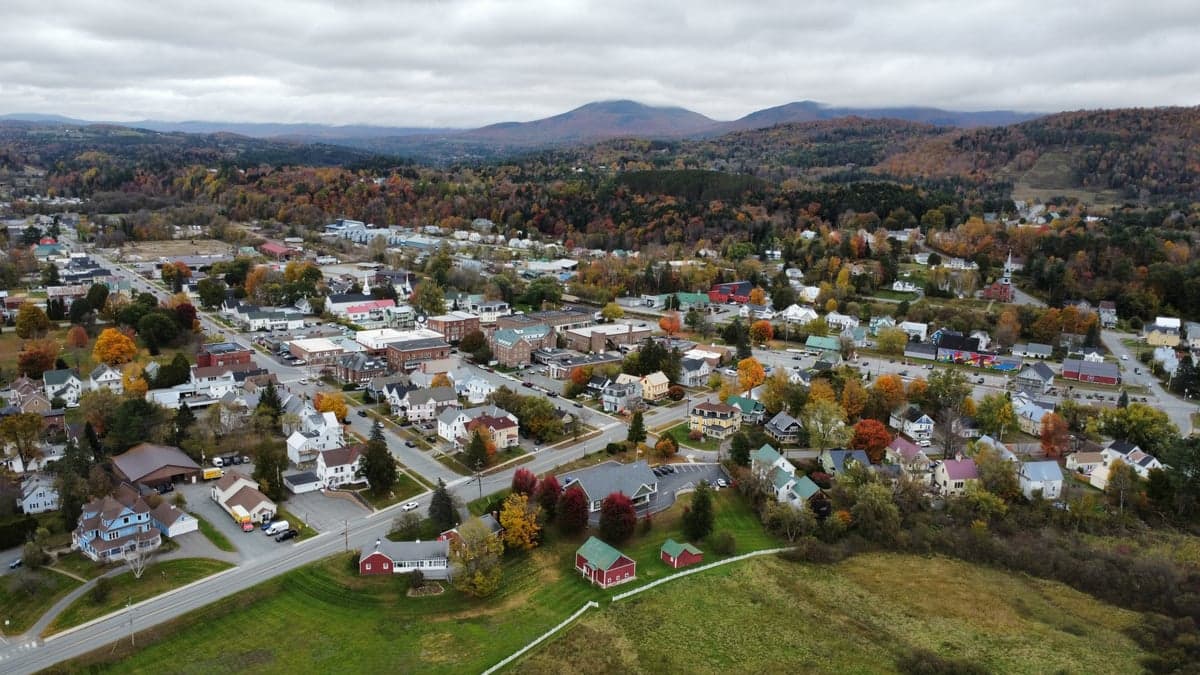
The people of Lyndonville, Vermont are a small, predominantly white population of 1,229 residents, characterized by a strong local identity rooted in the town’s 19th-century industrial past and a rural, family-oriented lifestyle. With 82.0% of residents identifying as white and a notable 10.5% Hispanic population, the community is less diverse than the national average but shows a specific Hispanic presence absent in many neighboring towns. The population density is low, and the town’s character is shaped by its historic village core, a legacy of mill-based settlement, and a college-educated rate of 24.7% that aligns with regional averages for rural Vermont. For a conservative-leaning audience, Lyndonville represents a stable, homogeneous community with a clear sense of place, though its demographic future hinges on modest growth and the retention of younger families.
How the city was settled and grew
Lyndonville was originally settled in the late 18th century by Anglo-American farmers and entrepreneurs drawn by the water power of the Passumpsic River. The town’s founding population was overwhelmingly of English and Scottish descent, arriving from southern New England and eastern New York after the American Revolution. The construction of the Passumpsic Railroad in the 1850s transformed Lyndonville from a farming hamlet into a mill town, attracting a wave of French-Canadian laborers who built the Lower Village neighborhood along the river. These families worked in the town’s woolen mills, paper mills, and machine shops, establishing a Catholic parish and a distinct cultural enclave that persists today in surnames and local traditions. A smaller wave of Irish immigrants arrived during the same period, settling in the Depot Street area near the railroad station. By 1900, Lyndonville’s population was nearly all white, with French-Canadian and Irish Catholic communities living alongside the older Yankee Protestant families in the Center Village district, which housed the town’s merchants and professionals. The decline of the mills after World War II led to population stagnation, but the town’s historic neighborhoods—Lower Village, Depot Street, and Center Village—retain their original housing stock and social character.
Modern era (post-1965)
After 1965, Lyndonville experienced little demographic change compared to larger Vermont towns. The foreign-born population is 0.0%, and the town has not seen significant immigration from Asia, Africa, or the Indian subcontinent. The most notable shift has been the growth of a Hispanic population, now 10.5%, which began in the 1990s and 2000s as families moved from Mexico and Central America to work in the region’s dairy farms, maple sugaring operations, and service industries. These new residents have concentrated in the East Lyndon area, a more rural fringe where affordable rental housing and farmworker housing are available. The white population, at 82.0%, remains the overwhelming majority, with many families tracing their roots to the original French-Canadian and Yankee settlers. The Lyndonville Village core has seen some in-migration of retirees and remote workers from southern New England, drawn by lower housing costs and a slower pace of life, but this has not substantially altered the town’s ethnic composition. The college-educated rate of 24.7% reflects the presence of Lyndon State College (now part of Vermont State University) in neighboring Lyndon Center, though Lyndonville itself remains a working-class community with a strong blue-collar identity.
The future
Lyndonville’s population is likely to remain small and predominantly white over the next 10-20 years, with the Hispanic share potentially growing slowly as families already in the area expand and new agricultural workers arrive. The town is not experiencing rapid diversification or tribalization into distinct ethnic enclaves; instead, the Hispanic community in East Lyndon is gradually integrating into the broader social fabric, with children attending local schools and adults working in mixed workplaces. The white population is aging, and out-migration of young adults for education and jobs in Burlington or out of state is a persistent challenge. The town’s future depends on retaining families through affordable housing and local employment, particularly in healthcare, education, and the trades. There is no sign of significant Asian, Black, or Indian subcontinent growth, as the data shows 0.0% for each group. Lyndonville will likely remain a culturally homogeneous, family-oriented community with a stable but slowly declining population, unless new economic development attracts a more diverse workforce.
For a conservative-leaning individual or family considering relocation, Lyndonville offers a safe, predictable environment with strong community ties, low crime, and a traditional rural lifestyle. The town is not becoming a diverse melting pot but rather a place where a small Hispanic minority is gradually integrating into a predominantly white, working-class culture. The key trade-off is stability versus opportunity: Lyndonville is ideal for those seeking a quiet, affordable, and historically rooted community, but it offers limited demographic variety and economic dynamism. New arrivals will find a welcoming but insular population, where local identity is tied to the town’s mill-town past and the rhythms of northern Vermont life.
* Values derived from national, state, county, city and local statistics and may differ in a specific area. Last updated: 2026-05-04T02:45:10.000Z
Narrative content on this page is AI-generated and may contain mistakes. Verify any details that matter before acting on them.
ReloMaps may earn a commission from affiliate links at no extra cost to you.