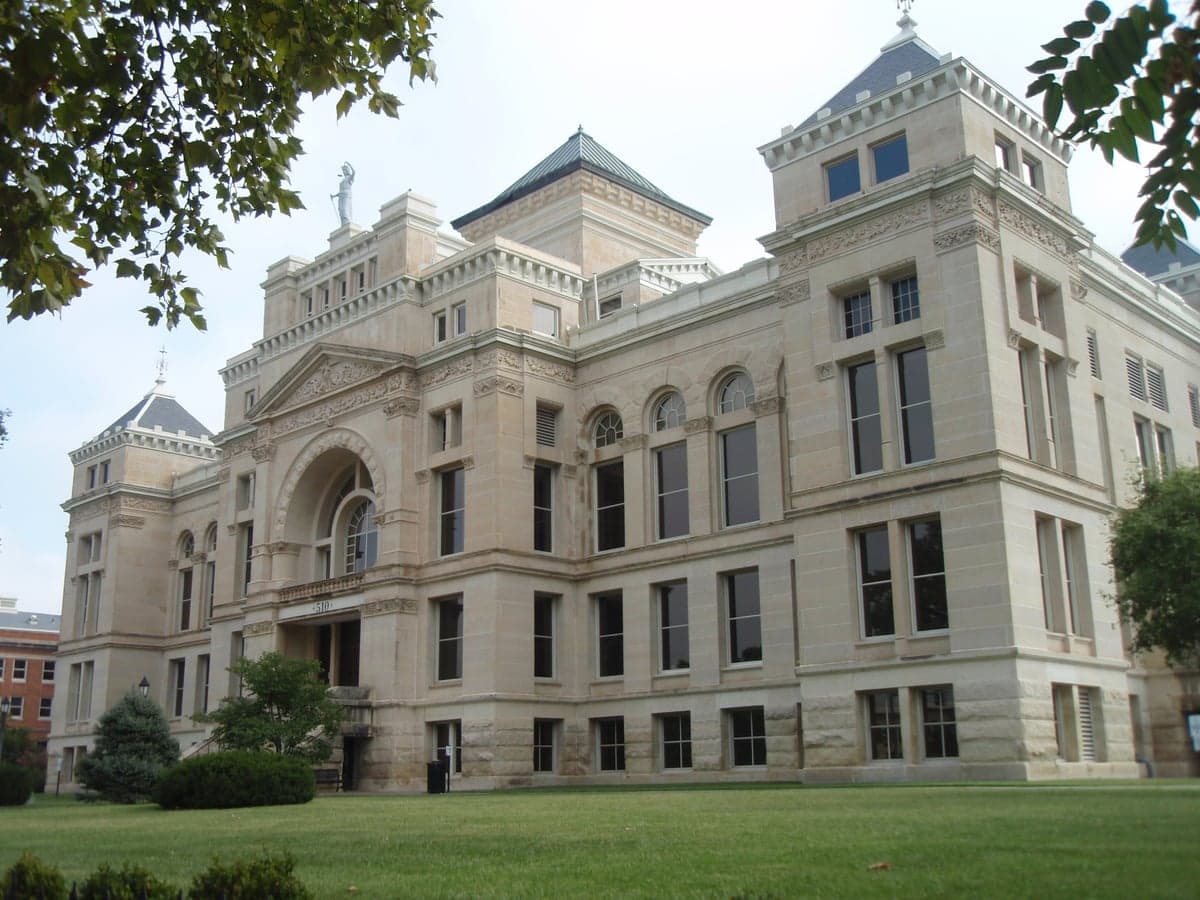
Photo: Wikipedia
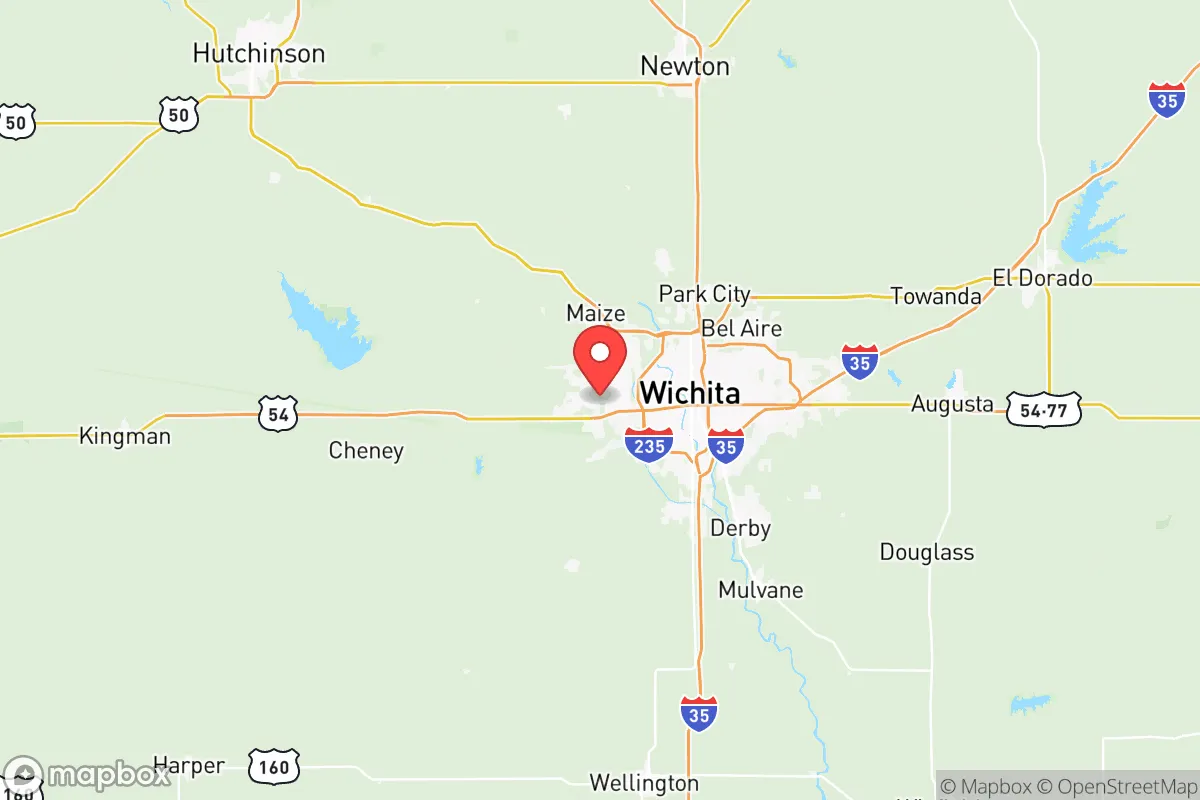
Demographics of Sedgwick County
Affluence Level in Sedgwick County
A middle-class area roughly in line with national averages across income, home values, education, and employment.
People of Sedgwick County
Today, Sedgwick County, anchored by Wichita, is home to 524,810 residents who form a predominantly white (65.5%) and increasingly diverse population shaped by waves of migration tied to agriculture, manufacturing, and aerospace. The county’s identity is rooted in a Midwestern work ethic, with a foreign-born share of just 4.5% — well below the national average — and a college-educated rate of 31.6% that reflects a blue-collar and professional mix. Hispanic residents make up 16.1% of the population, Black residents 7.8%, and East/Southeast Asian communities 3.6%, while Indian-subcontinent residents account for 0.5%. This is a place where the legacy of 19th-century settlers and 20th-century industrial workers still shapes daily life, even as newer immigrant groups and suburban growth slowly reshape the cultural landscape.
Settlement & growth (pre-1960)
Before American settlement, the area now known as Sedgwick County was home to the Wichita and Osage nations, who used the Arkansas River valley for hunting and seasonal camps. The land was part of the Louisiana Purchase and later designated for Native removal, but by the 1860s, the U.S. government had forced the tribes onto reservations in Oklahoma, opening the region to white homesteaders. The county was formally organized in 1870, named after General John Sedgwick, and its first permanent non-Native settlers were Anglo-American farmers from the Midwest and Upper South, drawn by the promise of cheap land under the Homestead Act.
The arrival of the railroad in the 1870s transformed the county. The Atchison, Topeka and Santa Fe Railway pushed through Wichita in 1872, turning the small trading post into a cattle-shipping hub. This period brought a wave of German and Czech immigrants, who settled in farming communities like Colwich and Andale in the northern part of the county, where their descendants remain a visible presence today. These groups were drawn by the availability of fertile land for wheat and corn, and they established tight-knit Catholic parishes that still anchor those towns. Meanwhile, Wichita itself grew rapidly as a rail and cattle center, attracting Anglo-American merchants, laborers, and a small number of freed slaves who moved west after Reconstruction.
The early 20th century brought a second major wave: the discovery of oil in the 1910s and 1920s sparked a boom that drew workers from Oklahoma, Texas, and the broader Midwest. Towns like Derby and Haysville grew as bedroom communities for oil-field laborers and refinery workers. The Great Depression and Dust Bowl of the 1930s pushed thousands of "Okies" and Arkansans into Sedgwick County, many of whom settled in Wichita’s working-class neighborhoods like Delano and North Wichita, seeking jobs in the city’s growing manufacturing sector. World War II cemented Wichita’s identity as the "Air Capital of the World," as aircraft plants like Boeing and Cessna drew workers from across the country, including a significant number of Black migrants from the South during the Second Great Migration. These workers settled in Wichita’s McAdams and Planeview neighborhoods, creating the foundation of the county’s Black community, which today stands at 7.8% of the population.
By 1960, Sedgwick County was overwhelmingly white (over 90%), with a small but established Black population and virtually no Hispanic or Asian presence. The economy was dominated by aircraft manufacturing, oil refining, and agriculture, and the population was concentrated in Wichita, with outlying towns like Goddard and Maize remaining small farming hamlets.
Modern era (post-1965)
The 1965 Hart-Cellar Act opened the door to new immigration, but Sedgwick County’s foreign-born share remained low compared to coastal regions. The most significant post-1965 shift has been the growth of the Hispanic population, which rose from negligible levels in 1970 to 16.1% today. This wave began in the 1970s and 1980s, driven by Mexican immigrants and later Central Americans, who came for jobs in meatpacking plants, construction, and agriculture. The Hispanic community concentrated in Wichita’s North End and South Central neighborhoods, as well as in the town of Haysville, where a growing number of Hispanic families have settled. Today, the Hispanic population is the fastest-growing demographic group in the county, driven by both immigration and higher birth rates.
East and Southeast Asian communities, now 3.6% of the population, began arriving in the 1970s and 1980s, primarily as refugees from the Vietnam War. Vietnamese and Lao families settled in Wichita’s East Side, near the former Boeing plant, where many found work in manufacturing. A smaller wave of Chinese and Korean immigrants came later, often as professionals in engineering and healthcare. The Indian-subcontinent community, at just 0.5%, is a more recent arrival, concentrated in Wichita’s College Hill and Eastborough neighborhoods, drawn by jobs in aerospace engineering and medicine at institutions like Via Christi Health.
Domestic migration has also reshaped the county since 1965. The decline of Rust Belt manufacturing in the 1980s brought a modest influx of workers from Michigan and Ohio, seeking jobs in Wichita’s still-thriving aircraft industry. More recently, suburbanization has pushed growth outward from Wichita. Towns like Derby (population 25,000) and Andover (population 15,000) have seen rapid expansion as families seek larger homes and better schools, drawing a mix of white, Hispanic, and Black residents. The Black population, now 7.8%, has become more suburbanized, with growing numbers in Derby and Bel Aire, though Wichita’s McAdams neighborhood remains a cultural center.
The future
Sedgwick County’s population is projected to grow slowly, reaching roughly 550,000 by 2040, driven primarily by Hispanic natural increase and modest domestic in-migration. The county is not homogenizing; instead, distinct enclaves are solidifying. The Hispanic population will likely continue to concentrate in Wichita’s North End and South Central neighborhoods, while East and Southeast Asian communities remain anchored on the East Side. The white population, still the majority at 65.5%, is aging and suburbanizing, with younger white families moving to Andover, Derby, and Maize, leaving Wichita’s urban core increasingly diverse. The Indian-subcontinent community, though small, is growing slowly through professional migration and will likely remain concentrated in affluent Wichita neighborhoods.
The cultural identity of the county is absorbing these changes gradually. The aircraft industry, still the economic backbone, remains a unifying force, but the county’s political and social character — historically conservative and white — is becoming more varied. Hispanic and Black residents are gaining political representation in Wichita, while outlying towns remain predominantly white and Republican. The next 10-20 years will likely see continued suburban expansion, a slow rise in the foreign-born share (possibly reaching 6-7%), and a steady decline in the white share to around 60% as the Hispanic population grows. The county will remain a Midwestern manufacturing hub, but its social fabric will become more layered, with distinct communities living side by side rather than blending into a single melting pot.
For someone moving in now, Sedgwick County offers a stable, affordable environment where the old Anglo-Germanic and Czech farming traditions coexist with a growing Hispanic and Asian presence. The county is not undergoing rapid transformation, but it is slowly diversifying, and newcomers will find a place where community identity is still strongly tied to specific towns and neighborhoods — from the Czech heritage of Colwich to the Vietnamese businesses of Wichita’s East Side. The bottom line: this is a county in gradual demographic transition, where the past remains visible and the future is being shaped by the children of today’s immigrant families.
* Values derived from national, state, county, city and local statistics and may differ in a specific area. Last updated: 2026-05-16T06:11:50.000Z
Narrative content on this page is AI-generated and may contain mistakes. Verify any details that matter before acting on them.
ReloMaps may earn a commission from affiliate links at no extra cost to you.