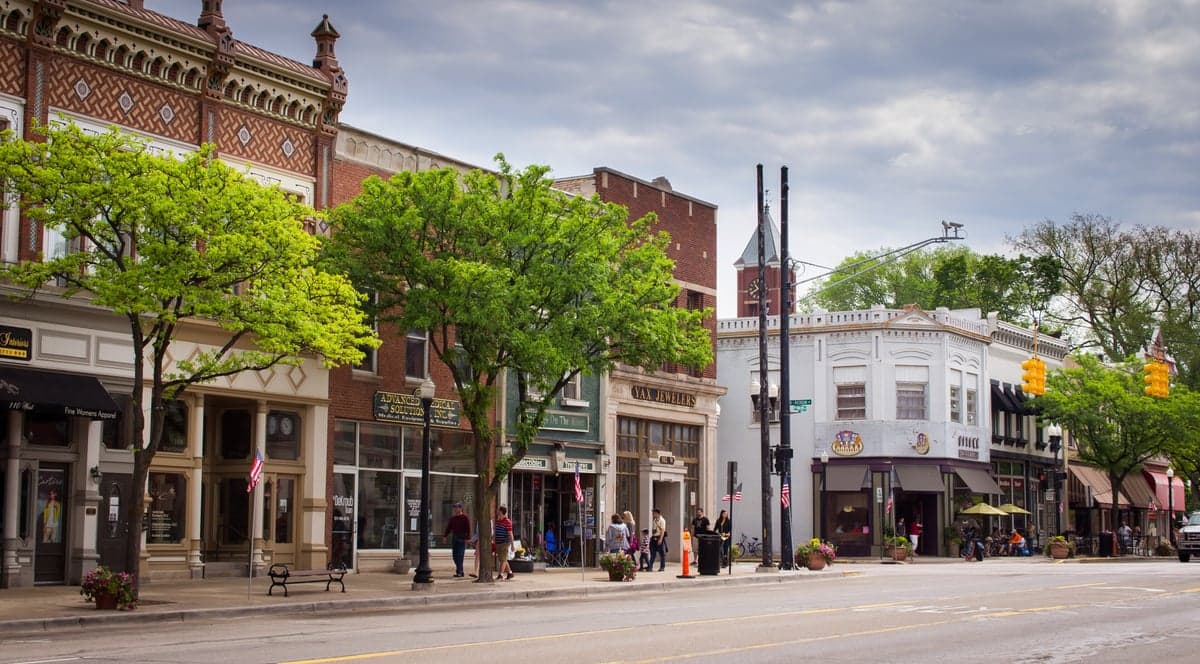
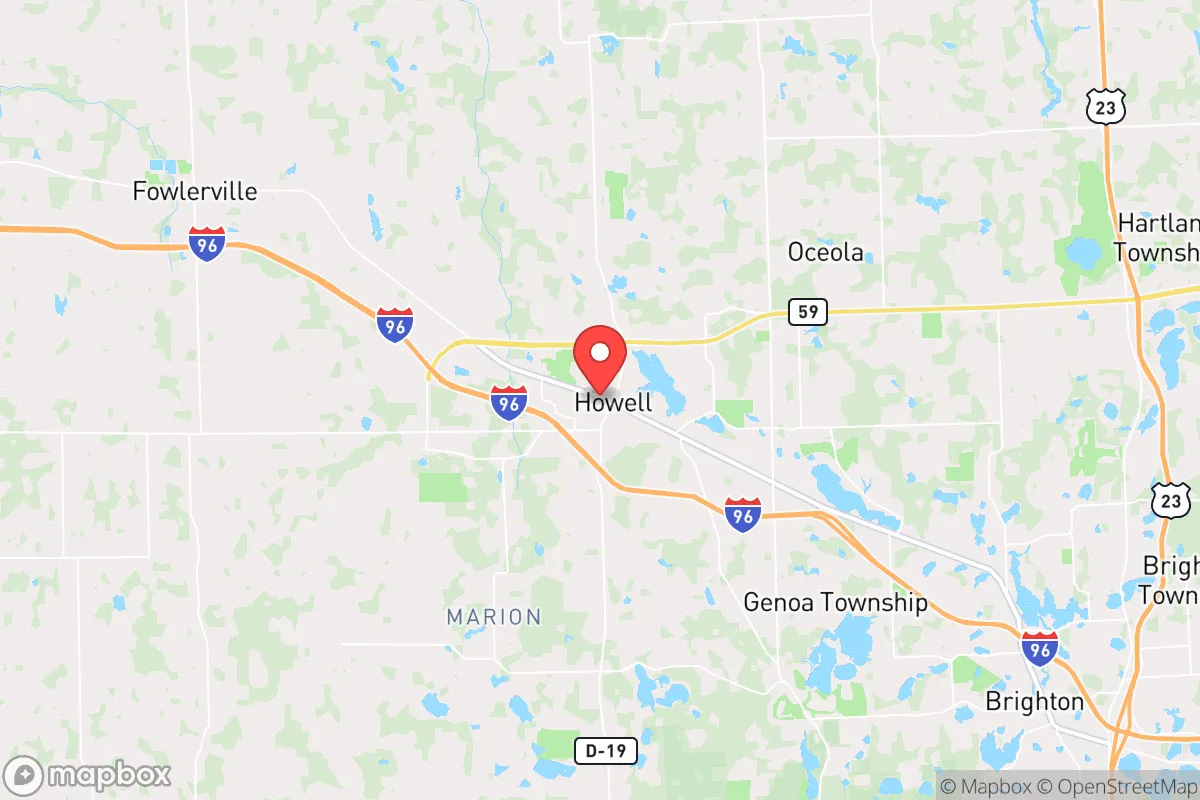

Photo: Wikipedia
Demographics of Howell, MI
Affluence Level in Howell, MI
A middle-class area roughly in line with national averages across income, home values, education, and employment.
People of Howell, MI
The people of Howell, Michigan, today number 10,074, forming a predominantly white (86.3%) community with a noticeably smaller Hispanic (9.3%) and Black (1.1%) presence than the state average. The city retains a distinct small-town, conservative character, anchored by a historic downtown and a strong sense of local identity, though its foreign-born population is low at just 2.5%. With 27.8% of adults holding a college degree, Howell is less educated than nearby Ann Arbor but more aligned with the broader Livingston County profile, attracting families and individuals who prioritize affordability, safety, and a slower pace of life over urban amenities.
How the city was settled and grew
Howell was founded in 1834 as a stagecoach stop and became the Livingston County seat in 1838, drawing its earliest settlers—primarily Yankee Protestants from New York and New England—who were attracted by cheap land grants under the federal land survey system. These original families built the core of what is now the Old Town Historic District, centered around Grand River Avenue, where many of the Greek Revival and Italianate homes still stand. A second wave arrived in the 1850s and 1860s, composed of Irish and German immigrants who worked on the Detroit, Grand Haven & Milwaukee Railroad and settled in the West Side neighborhood near the rail yards, an area that remains a working-class enclave. By the early 20th century, a small but established Polish community had formed around St. Mary Magdalen Catholic Church in the South Side area, drawn by agricultural and factory jobs. The city’s population grew slowly but steadily, reaching roughly 4,000 by 1950, with the economy shifting from farming to light manufacturing and county government services.
Modern era (post-1965)
The post-1965 period brought suburbanization from Detroit, as white middle-class families moved west along I-96 to escape urban decay and school desegregation. This wave, peaking in the 1970s and 1980s, filled subdivisions like Lake Forest and Woodland Creek on the city’s north and east sides, reinforcing Howell’s overwhelmingly white demographic profile. The Hispanic population, now 9.3%, began growing in the 1990s and 2000s, largely from Mexican and Central American families drawn to agricultural work in surrounding Livingston County and service jobs in Howell’s retail and construction sectors. These newer residents have concentrated in the East Side neighborhoods near the industrial corridor along Grand River Avenue, though the community remains dispersed rather than forming a single ethnic enclave. The Black population, at just 1.1%, has remained very small, with no distinct neighborhood concentration, reflecting the broader region’s persistent racial homogeneity. The Asian population (East/Southeast Asian) is 0.8%, and the Indian-subcontinent population is 0.0%, meaning no significant community from either group has formed. The foreign-born share of 2.5% is well below the national average, and the city has seen little of the immigration-driven diversity that has reshaped many other Michigan towns.
The future
Howell’s population is projected to remain stable or grow slowly, with the Hispanic share likely increasing to around 12-15% over the next decade as younger families move in from nearby counties and as existing residents age in place. The white population will continue to decline slightly as a share, but the city will remain overwhelmingly white and culturally conservative, with no major influx of Asian, Indian, or Black residents expected. New residential development is concentrated in the North Howell area near the Howell High School campus and along the M-59 corridor, where large-lot subdivisions are attracting families from more expensive Oakland County communities. The Downtown Historic District is seeing a modest revival of small businesses and loft apartments, drawing some younger professionals and empty-nesters, but the city’s cultural identity remains rooted in its agricultural and small-town past. For someone moving in now, Howell offers a stable, low-diversity community with a strong sense of place, but little demographic dynamism—a place where the population is slowly aging and the biggest change is the gradual growth of the Hispanic community, which is integrating without dramatically altering the city’s character.
In short, Howell is becoming a slightly more diverse but still overwhelmingly white and conservative small city, where the population is stable and new arrivals are mostly domestic families seeking space and safety. The city’s future is one of gradual, modest change rather than transformation, making it a predictable choice for those who value continuity over cosmopolitanism.

* Values derived from national, state, county, city and local statistics and may differ in a specific area. Last updated: 2026-10-05T07:50:30.000Z
Narrative content on this page is AI-generated and may contain mistakes. Verify any details that matter before acting on them.
ReloMaps may earn a commission from affiliate links at no extra cost to you.

