Photo: Wikipedia
Demographics of Fentress, TX
Affluence Level in Fentress, TX
A middle-class area roughly in line with national averages across income, home values, education, and employment.
People of Fentress, TX
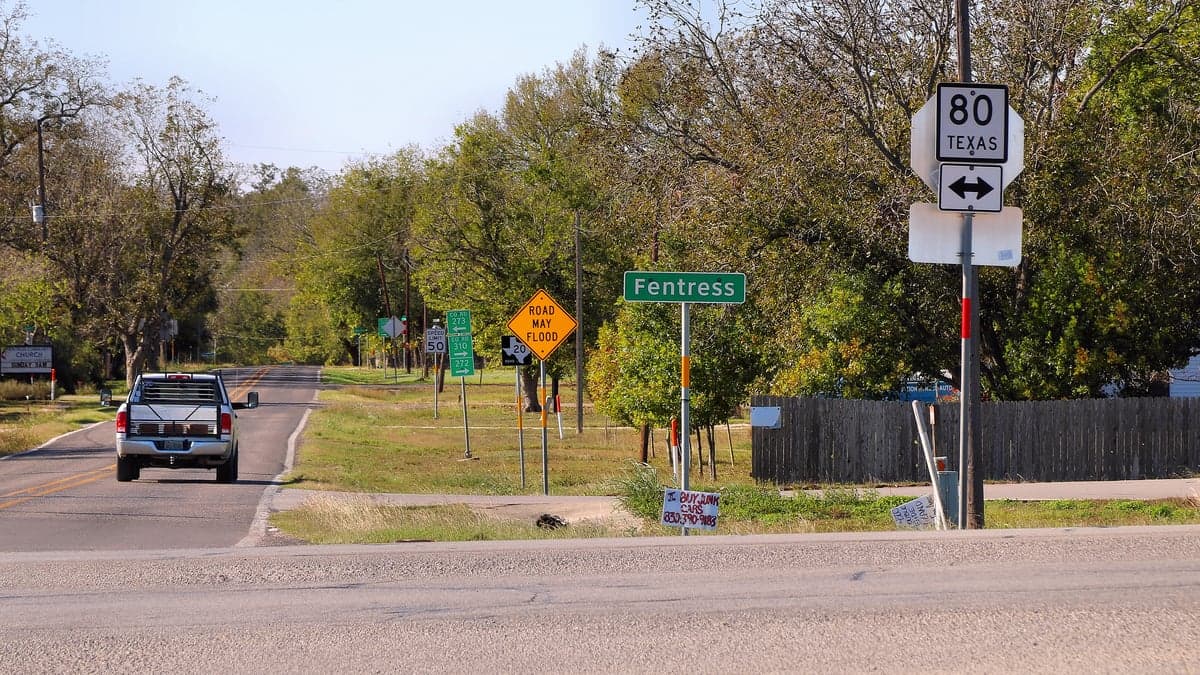
Today, Fentress, Texas, is a small, tight-knit community of 303 residents, characterized by a predominantly White (45.5%) and Hispanic (29.0%) population with a very small Black community (2.3%) and no recorded foreign-born, Asian, or Indian residents. The town’s identity is rooted in its rural, agricultural heritage, with a low population density and a strong sense of local history. Its residents are primarily native-born, with a college attainment rate of 23.6%, reflecting a working-class and middle-class character. The community is known for its quiet, family-oriented atmosphere, with a distinctive blend of Anglo and Tejano cultural traditions that have shaped its social fabric for generations.
How the city was settled and grew
Fentress was founded in the late 19th century as a railroad stop along the Missouri-Kansas-Texas (Katy) line, drawing its first permanent settlers—primarily Anglo-American farmers and ranchers—who were attracted by the fertile blackland prairie soil and the promise of cotton and cattle markets. The original settlement clustered around the railroad depot, an area now referred to as Old Town Fentress, where the first general store, post office, and blacksmith shop were established. By the early 1900s, a wave of German and Czech immigrants arrived, drawn by land availability and the region’s growing cotton economy; they settled in the Prairie View Addition, a neighborhood of small homesteads just east of the railroad tracks, where their descendants still live today. The town’s population remained small and predominantly Anglo through the mid-20th century, with the local economy sustained by cotton ginning, livestock, and the railroad. A significant demographic shift began in the 1940s and 1950s, when Mexican-American families—many of them migrant farmworkers—began settling permanently in Fentress, forming the core of what is now the Riverbend District, a low-lying area near the San Marcos River where they built modest homes and established a vibrant community anchored by the Our Lady of Guadalupe Mission Church.
Modern era (post-1965)
After the 1965 Hart-Cellar Act, Fentress saw no significant international immigration; its foreign-born population remains at 0.0% today. Instead, the modern era has been defined by domestic in-migration from nearby urban centers, particularly Austin and San Marcos, as families sought affordable rural living. This wave, beginning in the 1990s, brought a mix of White and Hispanic families to newer subdivisions like Oak Creek Estates, a development of single-family homes on larger lots west of the town center. The Hispanic population, which had been concentrated in the Riverbend District, began to disperse into these newer neighborhoods, though the area remains largely residentially integrated rather than segregated. The Black population, at 2.3%, is very small and does not form a distinct neighborhood, with most Black residents living in the Prairie View Addition alongside long-standing Anglo families. The town’s racial composition has shifted gradually: the White share has declined from an estimated 70% in 1990 to 45.5% today, while the Hispanic share has grown from roughly 20% to 29.0%, driven by higher birth rates among Hispanic families rather than new migration. The Asian and Indian populations remain at 0.0%, reflecting Fentress’s lack of the high-tech employment or university presence that attracts those groups to larger Texas cities.
The future
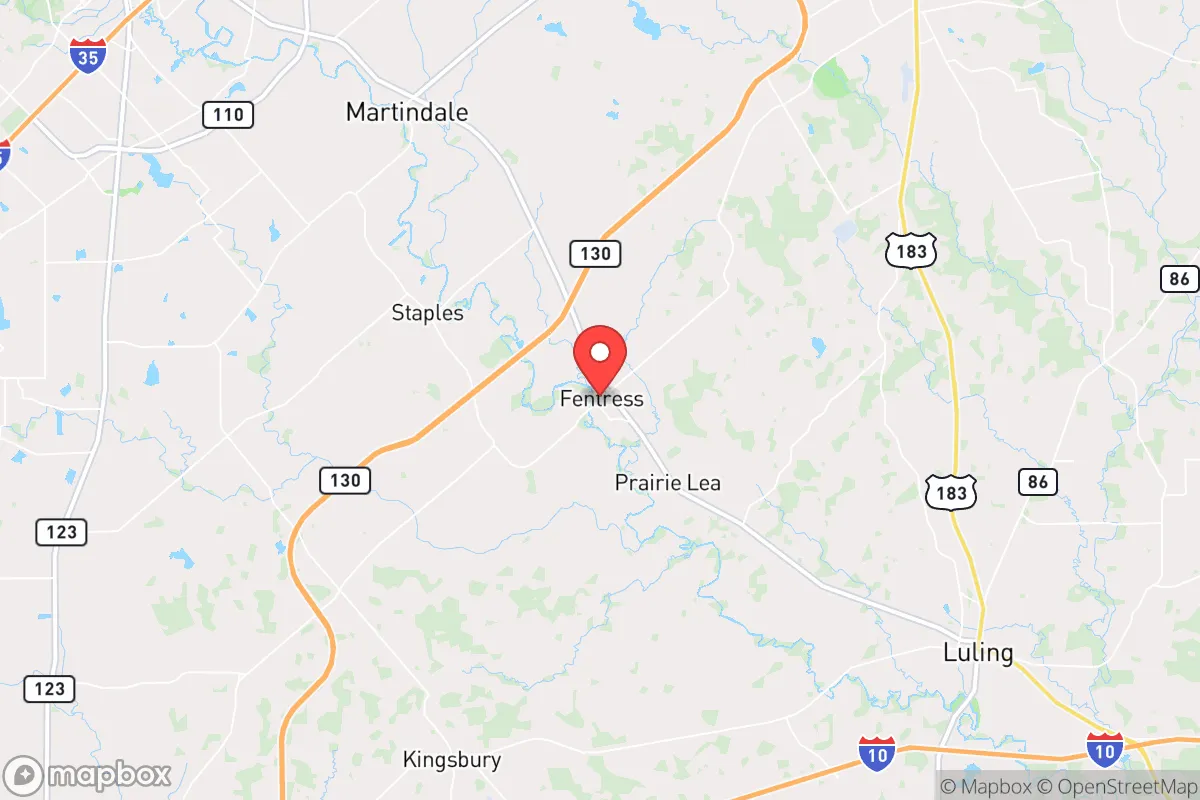
Fentress’s population is projected to remain very small and slow-growing, with modest increases driven by spillover from the Austin-San Marcos metropolitan area. The Hispanic share is likely to continue rising gradually, approaching 35-40% by 2040, as younger Anglo families move to larger towns for employment and Hispanic families have higher birth rates. New development is expected to concentrate in the Fentress Ranch Estates area, a planned subdivision of 1- to 5-acre lots on the town’s northern edge, which will likely attract a mix of White and Hispanic families seeking a rural lifestyle within commuting distance of San Marcos. The town’s cultural identity is evolving from a historically Anglo-dominated farming community to a more bicultural one, with Spanish increasingly heard in public spaces and local festivals blending Anglo and Tejano traditions. However, the population will remain overwhelmingly native-born and U.S.-raised, with no significant foreign-born influx expected. The college attainment rate, currently 23.6%, may rise slightly as new residents include remote workers and professionals, but Fentress is unlikely to gentrify rapidly due to its distance from major employment centers.
For someone moving in now, Fentress offers a stable, family-oriented community with a strong sense of place, where the population is slowly becoming more Hispanic but remains culturally conservative and rooted in rural values. The town is not diversifying in the way larger cities are—it lacks Asian, Indian, or foreign-born populations—but its Anglo-Hispanic blend is deepening. New residents should expect a quiet, low-cost lifestyle where neighbors know each other, and the biggest changes will come from gradual suburban infill rather than rapid transformation.

* Values derived from national, state, county, city and local statistics and may differ in a specific area. Last updated: 2026-09-03T06:07:58.000Z
Narrative content on this page is AI-generated and may contain mistakes. Verify any details that matter before acting on them.
ReloMaps may earn a commission from affiliate links at no extra cost to you.

