Photo: Wikipedia
Demographics of Easley, SC
Affluence Level in Easley, SC
A middle-class area roughly in line with national averages across income, home values, education, and employment.
People of Easley, SC
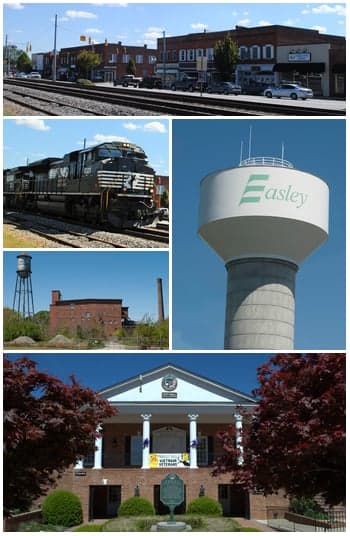
The people of Easley, South Carolina, today number roughly 23,942, forming a predominantly white (78.9%) and native-born (97.7% U.S.-born) community with a modest but growing Hispanic (7.7%) and Black (10.4%) presence. The city retains a distinctly small-town, family-oriented character, with 31.5% of adults holding a college degree and a population density that feels suburban rather than urban. Easley’s identity is shaped by its history as a railroad and textile mill town, and its residents today are a mix of long-standing Southern families, recent suburbanites from the Greenville metro area, and a small but emerging Hispanic workforce.
How the city was settled and grew
Easley’s population history begins with its 1873 founding as a railroad stop on the Atlanta and Charlotte Air Line Railway. The original settlers were largely Scotch-Irish and English farmers who moved into the foothills of the Blue Ridge Mountains, drawn by cheap land grants and the promise of rail access. The city’s first major growth wave came in the 1880s and 1890s with the arrival of textile mills—specifically the Easley Cotton Mill (1887) and later the Woodside Mill (1902). These mills attracted a wave of rural white families from the surrounding Upstate counties, who built the Mill Village neighborhoods—dense clusters of company-owned houses near the mill sites. The historic Old Easley district, centered around Main Street and the railroad depot, became the commercial and civic heart for these mill workers and their families. By 1900, the population had reached roughly 1,500, almost entirely native-born white Protestants. A second wave of white mill workers arrived during the 1920s and 1930s, settling in the West End neighborhood, which grew as the mills expanded. Black residents, though a small minority (around 5-7% historically), were largely confined to the East Side area near the railroad tracks, where they worked as domestic laborers and in service roles for the mill economy. The city remained overwhelmingly white and working-class through the mid-20th century, with the 1950 census recording a population of 6,000 and a Black share of just 6%.
Modern era (post-1965)
The post-1965 era brought two key shifts. First, the Immigration and Nationality Act of 1965 had minimal direct impact on Easley—the city’s foreign-born population remains just 2.3% today, far below the national average. Instead, the major demographic change was domestic: the suburbanization of Greenville. From the 1980s onward, Easley became a bedroom community for Greenville’s growing white-collar workforce, attracted by lower housing costs and a slower pace of life. This wave settled in newer subdivisions like Powdersville (a rapidly growing area on the city’s southern edge) and Dacusville (a rural-residential area to the east). These neighborhoods are predominantly white, with homeownership rates above 80%. The Hispanic population began growing in the 1990s and 2000s, driven by construction and landscaping jobs in the broader Greenville metro. Today, the 7.7% Hispanic share is concentrated in the West Easley area, near the old mill sites, where rental housing is more affordable. The Black population, at 10.4%, has grown modestly since 2000, with most Black residents living in the East Side and Old Easley neighborhoods, reflecting historical settlement patterns. East/Southeast Asian residents (0.4%) and Indian-subcontinent residents (0.0%) are virtually absent, a reflection of the city’s limited professional-sector job base and its distance from Greenville’s more diverse employment hubs.
The future
Easley’s population is likely to continue growing slowly, driven by domestic in-migration from higher-cost areas in the Northeast and Midwest, as well as from Greenville itself. The city is not homogenizing into a single cultural bloc; rather, it is tribalizing into distinct enclaves. The newer subdivisions (Powdersville, Dacusville) are attracting white families seeking good schools and low crime, while the older mill neighborhoods (West End, East Side) are becoming more diverse, with Hispanic and Black residents moving in as white families age out or sell. The Hispanic community is growing but remains small and largely assimilating into the broader working class; no distinct ethnic enclave has formed. The Black population is stable but not expanding rapidly. The foreign-born share is unlikely to rise above 5% in the next decade, as the city lacks the industrial or agricultural jobs that attract immigrant labor. The college-educated share (31.5%) is below the national average but rising, as more professionals commute to Greenville’s tech and healthcare sectors.
For someone moving in now, Easley is becoming a stable, family-oriented suburb with a conservative, churchgoing culture and a slowly diversifying population. The city’s future is one of gradual suburban infill rather than explosive growth, with the main demographic story being the replacement of aging mill-town families with younger, more educated newcomers from outside the region. The neighborhoods to watch are Powdersville for growth and West Easley for demographic change, while Old Easley remains the historic anchor.
* Values derived from national, state, county, city and local statistics and may differ in a specific area. Last updated: 2026-04-22T02:40:25.000Z
Narrative content on this page is AI-generated and may contain mistakes. Verify any details that matter before acting on them.
ReloMaps may earn a commission from affiliate links at no extra cost to you.