Photo: Wikipedia
Demographics of Navajo County
Affluence Level in Navajo County
A below-average socioeconomic profile. Incomes, home values, and educational attainment trail the U.S., with higher poverty and unemployment.
People of Navajo County
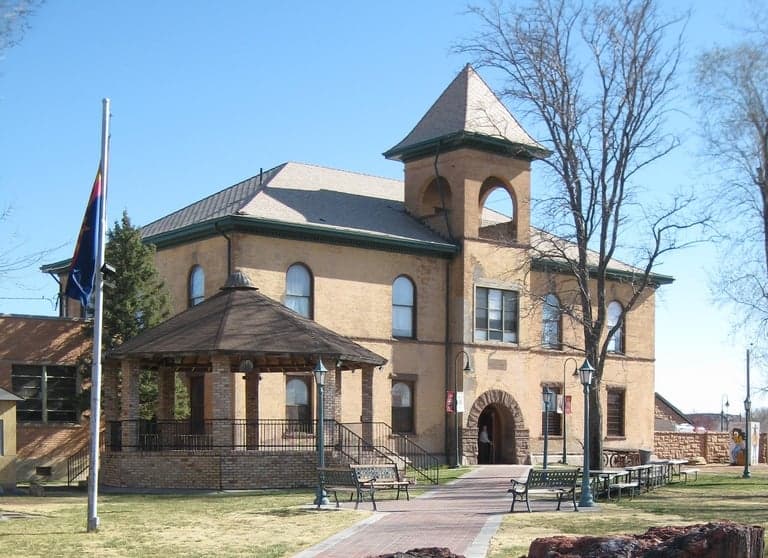
The people of Navajo County, Arizona, today are defined by a stark demographic duality: a 42.4% white population living alongside a 42.6% Native American population (primarily Navajo and Hopi), with a small but growing Hispanic community at 10.6%. With a total population of 107,744, the county is one of the most sparsely populated in the state, with a density of just 11 people per square mile. Its distinctive identity is rooted in the sovereign Navajo Nation and Hopi Reservation, which cover most of the county's land, creating a unique cultural landscape where tribal governance, traditional lifeways, and a small but persistent Anglo ranching and mining heritage coexist. The county's foreign-born population is negligible at 1.0%, and only 17.6% of adults hold a college degree, reflecting a rural, resource-based economy.
Settlement & growth (pre-1960)
Human history in Navajo County begins with the Ancestral Puebloans, who inhabited the region from roughly 500 to 1300 AD, leaving behind cliff dwellings at sites like Betatakin and Keet Seel in what is now the Navajo National Monument. By the time of European contact, the area was home to the Navajo (Diné) and Hopi peoples, who had established settled agricultural communities. The Hopi villages on the three mesas—including First Mesa, Second Mesa, and Third Mesa—are among the oldest continuously inhabited settlements in North America, dating back over a thousand years. The Navajo, who arrived later (circa 1400-1500 AD), became the dominant group, with a semi-nomadic pastoral economy centered on sheep herding.
Spanish exploration in the 16th and 17th centuries left little permanent mark on Navajo County, as the area was too remote and arid for mission or presidio settlement. The region remained under Spanish and then Mexican control until 1848, when the Treaty of Guadalupe Hidalgo ceded it to the United States. The first significant Anglo-American incursion came with the 1864 Long Walk, when the U.S. Army forcibly removed the Navajo to Bosque Redondo, New Mexico. After their return in 1868, the Navajo Reservation was established, and the tribe began rebuilding. The Hopi Reservation was created by executive order in 1882, carving out a smaller enclave within the larger Navajo territory.
Anglo settlement in Navajo County was sparse and late, driven not by homesteading but by extractive industries. The railroad arrived in the 1880s, with the Atlantic and Pacific Railroad (later the Santa Fe) building a line through the southern part of the county. This spurred the founding of Holbrook in 1881 as a railroad and ranching center. Holbrook became the county seat in 1895 and remains the largest Anglo-majority town, with a population of about 5,000. Ranching dominated the economy through the early 20th century, with cattle and sheep operations spreading across the open range. The town of Snowflake, founded in 1878 by Mormon settlers from Utah, became a distinct Latter-day Saint enclave, while Taylor, just south of Snowflake, was settled by Mormon families in the 1880s. These communities remain predominantly white and Mormon today.
The discovery of coal in the Black Mesa region in the 1920s and the construction of the Navajo Generating Station near Page in the 1960s brought a new wave of workers—engineers, miners, and construction laborers—many of whom were white and from other parts of the Southwest. Page itself was founded in 1957 as a housing camp for workers building the Glen Canyon Dam, and it grew rapidly as a service hub for the dam and later for tourism at Lake Powell. By 1960, the county's population had reached about 37,000, with roughly equal numbers of Native Americans and whites, and a tiny Hispanic minority.
Modern era (post-1965)
The 1965 Hart-Cellar Act had minimal direct impact on Navajo County, as the region's foreign-born population remains at just 1.0%—far below the national average. Instead, the major demographic shifts since 1965 have been driven by internal migration and natural increase. The Native American population has grown substantially through high birth rates, rising from about 40% of the county in 1970 to 42.6% today. The Navajo Nation's population within the county is concentrated in communities like Kayenta, Chinle, and Tuba City (the latter partially in Coconino County), while the Hopi Reservation's population centers on the villages of Kykotsmovi and Polacca.
The white population, while still the largest single group at 42.4%, has grown more slowly, as the ranching and mining economies have stagnated. The closure of the Navajo Generating Station in 2019 and the decline of coal mining on Black Mesa have led to job losses and out-migration from towns like Page and Holbrook. The Hispanic population has increased from about 5% in 1990 to 10.6% today, driven by migration from Mexico and other parts of the Southwest for work in construction, hospitality, and agriculture. Hispanic residents are most concentrated in Holbrook and Page, where they form visible communities. The Black population remains tiny at 1.1%, and East/Southeast Asian communities are negligible at 0.4%, with no significant Indian subcontinent population.
Suburbanization has been limited in Navajo County due to its rural character and the vast landholdings of the Navajo and Hopi tribes. The only area that has seen suburban-style growth is the Show Low region in the county's far south, which has attracted retirees and second-home buyers from Phoenix and Tucson. Show Low, along with Pinetop-Lakeside, has become a white-majority recreational and retirement destination, with a growing Hispanic service workforce. However, these towns are small (Show Low's population is about 11,000) and do not fundamentally alter the county's demographic structure.
The future
Navajo County is likely to become slightly more diverse over the next 10-20 years, but the pace of change will be slow. The Native American population is projected to grow through natural increase, maintaining its roughly 42% share. The Hispanic population will continue to rise gradually, potentially reaching 15-18% by 2040, as younger Hispanic families move in for service-sector jobs and lower housing costs. The white population will likely decline in absolute numbers as the older Anglo population ages and younger whites leave for urban job markets. The county's cultural identity will remain bifurcated: the reservation areas will stay predominantly Navajo and Hopi, while the southern towns (Show Low, Pinetop-Lakeside) and the railroad corridor (Holbrook, Snowflake) will remain white-majority with growing Hispanic minorities.
New communities are not likely to form; instead, existing towns will slowly change in composition. The biggest unknown is the future of coal and energy jobs. If renewable energy projects (solar, wind) or tourism (Lake Powell, the Petrified Forest National Park) expand, they could attract a more diverse workforce, including younger, college-educated professionals. However, the county's low educational attainment (17.6% college educated) and remote location will limit this trend. The foreign-born population is unlikely to rise significantly, as the county lacks the urban infrastructure and ethnic enclaves that attract immigrants.
For someone moving in now, Navajo County offers a choice between two distinct worlds: the sovereign tribal nations with their own laws and cultures, and the small Anglo towns with a ranching and Mormon heritage. The county is becoming slightly more Hispanic and slightly less white, but it remains one of the most culturally and politically conservative regions in Arizona, with a strong libertarian streak. The population is stable but aging, and the economy is transitioning from extraction to tourism and services. It is a place where community ties are strong, but economic opportunity is limited, and where the landscape—high desert, red rock canyons, and pine forests—is the primary attraction.

* Values derived from national, state, county, city and local statistics and may differ in a specific area. Last updated: 2026-08-27T20:32:06.000Z
Narrative content on this page is AI-generated and may contain mistakes. Verify any details that matter before acting on them.
ReloMaps may earn a commission from affiliate links at no extra cost to you.

