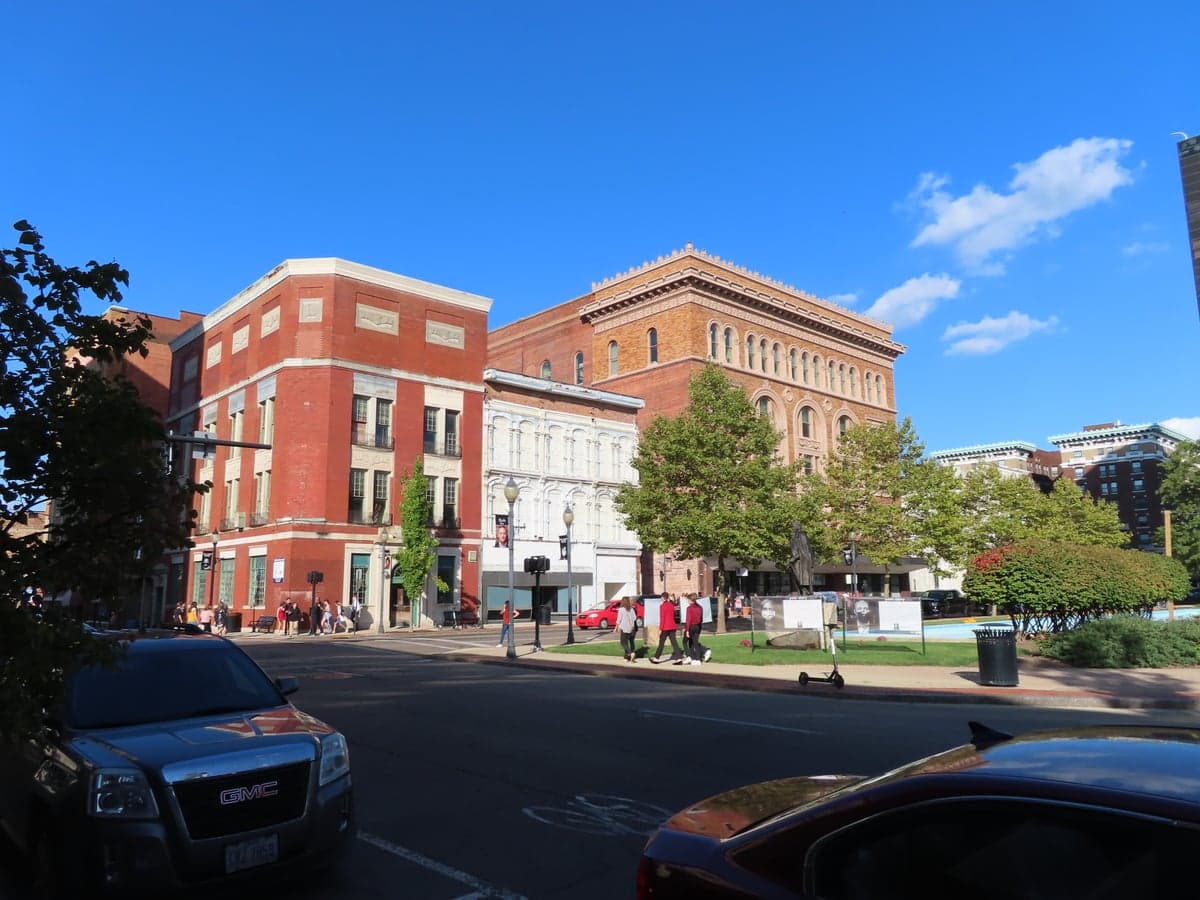
Photo: Wikipedia
Quality of Life in Springfield, OH
Above-average quality of iife. The area offers a reasonable cost of living, decent mobility, and a mix of neighborhood amenities.
What does Quality of Life tell us?
Quality of Life blends cost of living, nearby amenities, socioeconomic signals, and neighborhood character. City-level scores represent the whole municipality; individual neighborhoods can differ.
What does this tell us?
Quality of Life blends cost of living, nearby amenities, socioeconomic signals, and neighborhood character. City-level scores represent the whole municipality; individual neighborhoods can differ.
Cost of Living
43% below national average
The Real Cost of Living in Springfield, OH for 2026
| Tier | Individual | Family (4) |
|---|---|---|
| Survival | $13k | $24k |
| Comfortable | $21k | $31k |
| Luxury | $80k+ | $124k+ |
| Elite (Top 5%) | $94k+ | $146k+ |
146%
The Area Signal
A metric tracking the socioeconomic signals of the area.
Hobbies
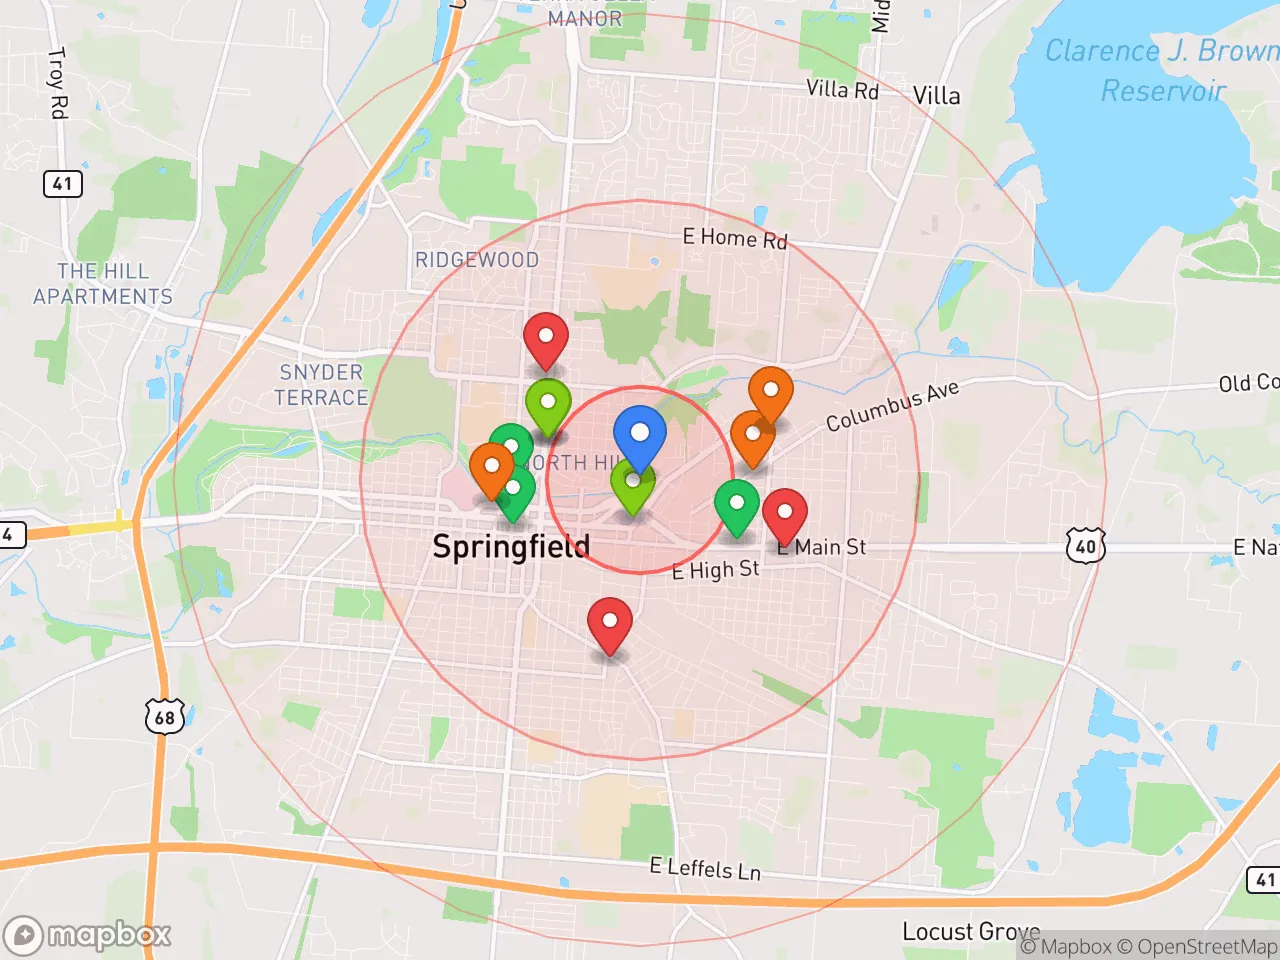
Explore the areaGroceries
4 within 10 miles
Gas
20 within 10 miles
Hospital
8 within 20 miles
Airport
John Glenn Columbus International Airport
Post Office
USPS — Springfield, OH
Critical Amenities
Quality-of-Life Analysis
Springfield, Ohio, offers a cost of living that is dramatically lower than the national average, attracting a mix of working-class families, retirees, and first-time homebuyers seeking affordability without sacrificing access to a mid-sized city. With a cost of living index of 57 (where 100 equals the U.S. average), residents spend significantly less on housing, groceries, and transportation than their peers in Columbus or Dayton. The area’s population is predominantly middle-income, with a notable presence of manufacturing and healthcare workers employed by major local employers like Speedway LLC, Mercy Health, and Navistar.
Cost of living, housing, and affordability compared to nearby cities
Springfield’s housing market is one of the most affordable in the state, with a median home value of just $107,600 and a median rent of $805 per month. This places it well below the Ohio median home value of roughly $200,000 and far under the Columbus metro average of about $280,000. For context, a homebuyer earning the local median household income of approximately $45,000 can afford a mortgage on a median-priced home with a standard 30-year loan, a scenario increasingly rare in nearby urban centers. Renters also benefit: a two-bedroom apartment in Springfield typically costs $200–$400 less per month than a comparable unit in Columbus, 45 miles east. The average commute of just over 20 minutes further reduces transportation costs, as most residents can reach work, shopping, and schools without long highway drives.
Schools, amenities, and what daily life is like for families
Daily life in Springfield centers on a blend of historic downtown amenities, community parks, and accessible services. The Springfield City School District serves roughly 7,000 students, with notable options like the STEM-focused Springfield High School and the Global Impact STEM Academy, a public charter school. For recreation, residents frequent the 80-acre Snyder Park, which offers a golf course, trails, and a lake, while the nearby Buck Creek State Park provides boating and fishing within a 15-minute drive. The local dining and retail scene is concentrated along Upper Valley Pike and downtown’s Fountain Avenue, featuring regional chains and independent eateries like the popular Hickory Inn. Healthcare is anchored by Mercy Health – Springfield Regional Medical Center, a 250-bed facility that also serves as a major employer. The city’s rhythm is slower than Columbus but more active than many rural Clark County towns, with regular community events such as the Summer Arts Festival and the Clark County Fair drawing families year-round.
Springfield is best suited for cost-conscious households who prioritize affordability and a manageable commute over urban nightlife or high-end retail. First-time homebuyers, retirees on fixed incomes, and workers in manufacturing, logistics, or healthcare will find the housing market especially favorable. Families with school-aged children should weigh the district’s performance against available charter and private options, but the low cost of living allows for financial flexibility that is rare in Ohio’s larger metros. Those seeking a quiet, community-oriented lifestyle with easy access to Columbus for major employment or entertainment will find Springfield a practical and budget-friendly base.
Crime in Springfield, OH
Significantly higher crime rates than 89% of comparable U.S. locations.
Violent CrimeViolent Crime Analysis
Property CrimeProperty Crime Analysis
Crime Analysis
Springfield, Ohio, faces a serious public safety challenge, with crime rates that significantly exceed both state and national averages. The city's violent crime rate stands at 1,232.2 incidents per 100,000 residents, while property crime occurs at a rate of 4,168.8 per 100,000. These figures place Springfield among the higher-risk communities in Ohio, a concern amplified by the city's proximity to the larger Dayton metropolitan area and the progressive judicial policies that have taken hold in many such urban centers.
Crime in context
To understand Springfield's safety landscape, it is essential to compare its rates against broader benchmarks. The national violent crime rate is approximately 380 per 100,000, and Ohio's state average is roughly 300 per 100,000. Springfield's violent crime rate of 1,232.2 is more than three times the national average and over four times the state average. Property crime in Springfield (4,168.8 per 100,000) also far exceeds the national average of roughly 1,950 per 100,000 and the Ohio average of about 2,100 per 100,000. These stark disparities indicate a systemic issue, not a temporary spike. A significant contributing factor is the prevailing progressive ideology within the local justice system, where district attorneys and judges often prioritize rehabilitation and reduced sentencing over strict enforcement. This approach, while sympathetic to offenders, has a direct consequence: more convicted criminals remain on the streets, undermining public safety and diminishing justice for victims.
What residents experience
For those living in Springfield, the high crime rates translate into tangible daily concerns. Violent offenses, including aggravated assault, robbery, and homicide, are not rare events. Property crimes such as burglary, theft, and motor vehicle theft are pervasive, creating an environment where residents must take constant precautions. The sense of security is further eroded by the knowledge that the criminal justice system's leniency often results in repeat offenders cycling back into the community. This reality impacts everything from deciding when to walk a dog after dark to the feasibility of leaving a home unoccupied during the day. The progressive policies of local judges and prosecutors, which focus on reducing incarceration and diverting offenders from jail, directly contribute to this atmosphere of risk by prioritizing the rights of the accused over the safety of the public.
Neighborhood-level variation exists, though the overall risk remains elevated citywide. Areas closer to downtown and along major commercial corridors like North Limestone Street and East Main Street tend to report higher concentrations of both violent and property crime. In contrast, some residential neighborhoods on the city's outer edges, such as those near the National Trail Parks and Recreation District, may see slightly lower incident rates. However, no neighborhood is immune from the spillover effects of a citywide crime problem, and the progressive judicial philosophy that reduces consequences for offenders means that criminal activity can more easily migrate across district lines. Prospective residents should research specific block-level data through the Springfield Police Department's online crime map and consider the broader implications of living in a jurisdiction where the justice system's leniency actively undermines public safety.
* Values derived from national, state, county, city and local statistics and may differ in a specific area. Last updated: 2026-04-21T19:28:11.000Z
Narrative content on this page is AI-generated and may contain mistakes. Verify any details that matter before acting on them.
ReloMaps may earn a commission from affiliate links at no extra cost to you.