Photo: Wikipedia
Demographics of Seaford, DE
Affluence Level in Seaford, DE
A below-average socioeconomic profile. Incomes, home values, and educational attainment trail the U.S., with higher poverty and unemployment.
People of Seaford, DE
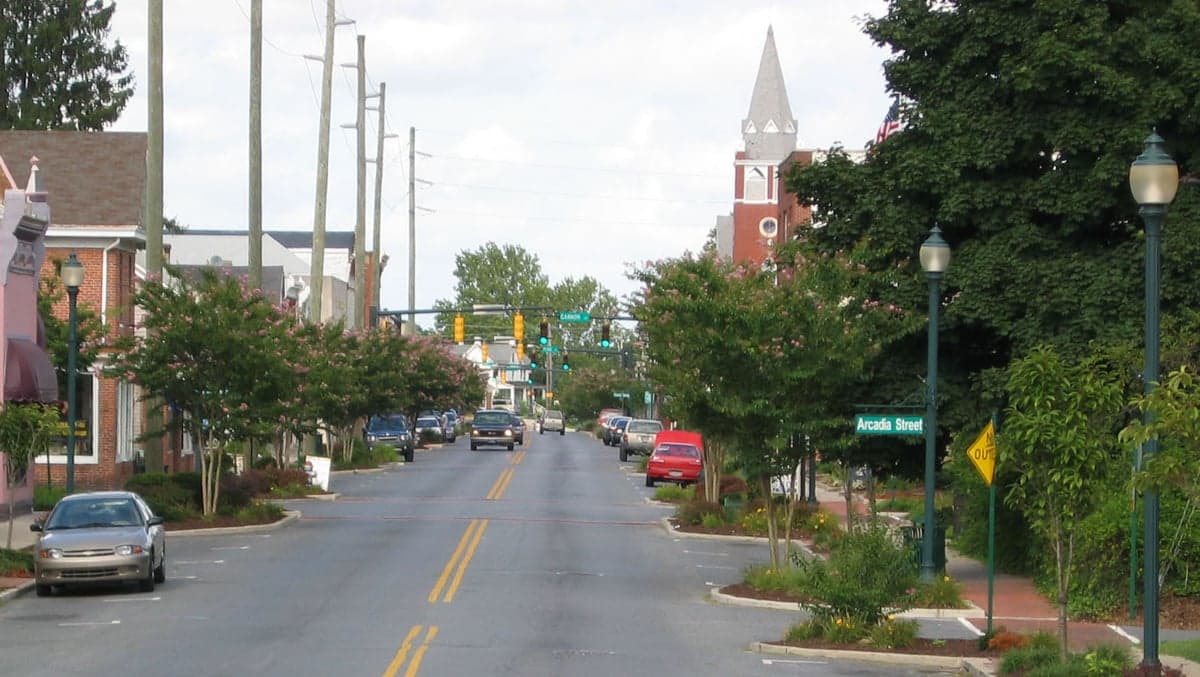
Today, Seaford, Delaware is a small city of 8,255 residents with a notably diverse and working-class character, shaped by decades of industrial change and migration. Its population is roughly half White (50.5%), a quarter Black (24.1%), and over a tenth Hispanic (10.5%), with a small East/Southeast Asian community (2.2%) and a foreign-born share of 8.3%. The city’s identity is rooted in its history as a company town for the DuPont nylon plant, and its present-day neighborhoods reflect the distinct waves of workers who built and sustained that industry. Only 17.5% of adults hold a college degree, underscoring a blue-collar, family-oriented community where manufacturing and logistics remain central to daily life.
How the city was settled and grew
Seaford’s population history begins not with colonial settlement but with the arrival of the railroad and industry. Founded in the late 18th century as a small agricultural crossroads on the Nanticoke River, the city remained a modest trading post for decades. The transformative event came in 1939, when DuPont opened a massive nylon plant just west of the downtown core, drawn by the river’s water supply and rail access. This factory, which produced the world’s first synthetic fiber, triggered an immediate population boom. Workers poured in from rural Sussex County, the Eastern Shore of Maryland, and the broader Mid-Atlantic region. The original workforce was overwhelmingly White, drawn from local farming families and small towns. These workers settled in the Historic West Seaford neighborhood, a grid of modest frame houses built by DuPont near the plant, and in the Central Avenue corridor, which became the city’s commercial and residential spine. By 1950, Seaford’s population had more than doubled from its pre-war level, and the city had taken on the character of a company town—stable, insular, and dependent on a single employer.
Modern era (post-1965)
The 1965 Hart-Cellar Act and the subsequent decline of the DuPont plant reshaped Seaford’s population dramatically. As the nylon industry faced global competition and automation, DuPont began cutting jobs in the 1970s and 1980s. The White workforce that had dominated the plant for decades began to age out or leave, and the city’s population stagnated. At the same time, new groups arrived to fill lower-wage positions in the remaining manufacturing and service sectors. Black families, many with roots in the rural South and the Delmarva Peninsula, moved into neighborhoods like North Seaford and the East Side near the Nanticoke River, areas that had previously been segregated or less developed. Hispanic immigrants, primarily from Central America and Mexico, began arriving in the 1990s and 2000s, drawn by work in poultry processing plants in nearby towns and in Seaford’s remaining light manufacturing. They concentrated in the South Seaford area, near the industrial corridor along U.S. Route 13, and in rental housing around Stein Highway. The East/Southeast Asian community, though small at 2.2%, is largely composed of Vietnamese and Filipino families who came in the 1980s and 1990s, many connected to the seafood and poultry industries; they are scattered across the city but have a visible presence near the Seaford Plaza shopping center. Today, the city’s racial and ethnic groups are not fully integrated into a single melting pot—neighborhoods remain somewhat distinct, with White residents concentrated in West Seaford and the newer subdivisions on the western edge, Black residents in the north and east, and Hispanic residents in the south.
The future
Seaford’s population is likely to continue its slow diversification, but the pace is uncertain. The White share has declined steadily from over 70% in 1990 to 50.5% today, while the Hispanic share has grown from near zero to 10.5% in the same period. The Black population has remained relatively stable, hovering around 24% for the past two decades. The foreign-born share, at 8.3%, is modest but growing, driven primarily by Hispanic immigration. However, the city’s low college attainment rate (17.5%) and limited high-wage job base mean that it is not attracting the kind of professional, diverse influx seen in Delaware’s northern suburbs. Instead, Seaford is becoming a more working-class, multiethnic city where the old DuPont-era White population is aging and shrinking, while younger Hispanic and Black families move in. The next 10-20 years will likely see the Hispanic share rise to 15-20%, the White share fall below 45%, and the Black share remain steady. The city is not tribalizing into hostile enclaves, but it is also not homogenizing—neighborhoods will likely retain their current ethnic character, with West Seaford remaining predominantly White and South Seaford becoming increasingly Hispanic. New subdivisions on the western edge, such as Heritage Shores (a 55+ community), are drawing some retirees but are not changing the overall demographic trajectory.
For someone moving in now, Seaford is a city in transition—still anchored by its industrial past, but becoming more diverse and more working-class by the year. It offers affordable housing and a slower pace of life, but the economic base is narrow, and the population is not growing rapidly. The city’s future is one of gradual diversification without dramatic growth, where the old company-town identity fades and a new, more multiethnic working-class identity takes shape.
* Values derived from national, state, county, city and local statistics and may differ in a specific area. Last updated: 2026-04-29T23:40:57.000Z
Narrative content on this page is AI-generated and may contain mistakes. Verify any details that matter before acting on them.
ReloMaps may earn a commission from affiliate links at no extra cost to you.