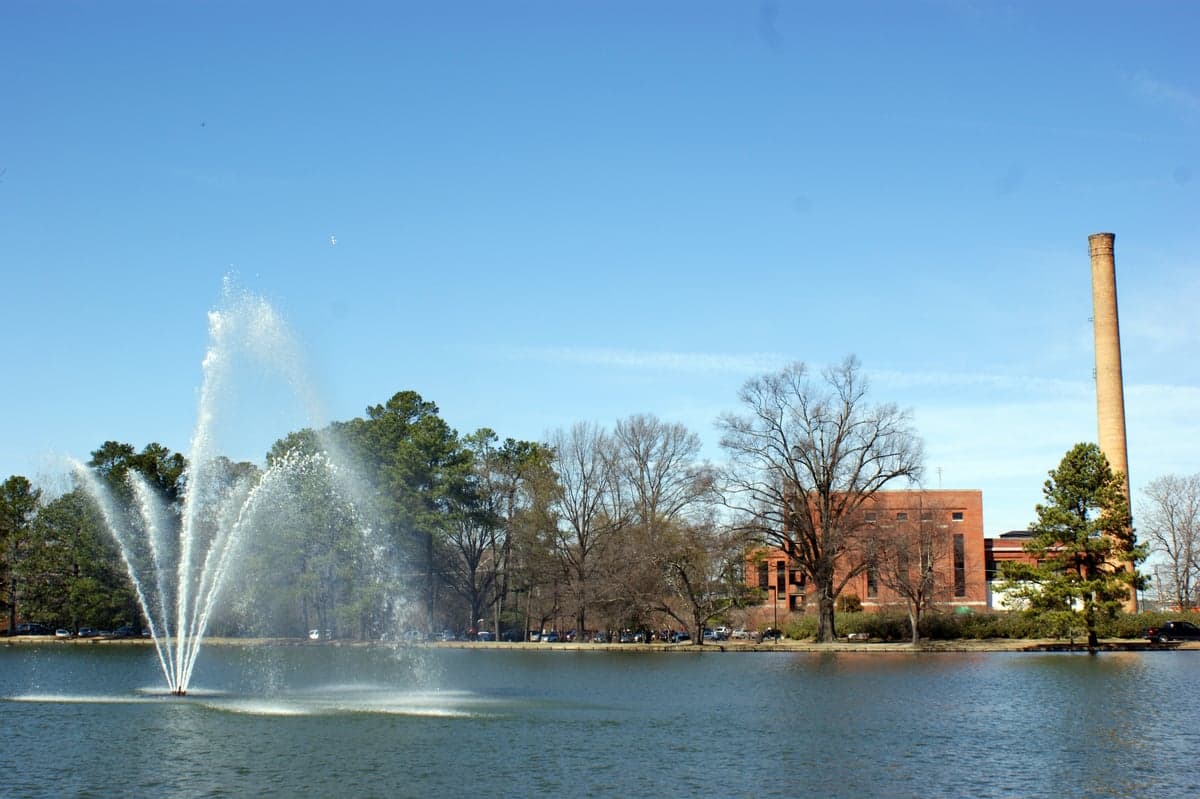
Photo: Wikipedia
Quality of Life in Rocky Mount, NC
A high quality of life with strong walkability, manageable living costs, healthy neighborhood signals, and solid amenity access.
What does Quality of Life tell us?
Quality of Life blends cost of living, nearby amenities, socioeconomic signals, and neighborhood character. City-level scores represent the whole municipality; individual neighborhoods can differ.
What does this tell us?
Quality of Life blends cost of living, nearby amenities, socioeconomic signals, and neighborhood character. City-level scores represent the whole municipality; individual neighborhoods can differ.
Cost of Living
32% below national average
The Real Cost of Living in Rocky Mount, NC for 2026
| Tier | Individual | Family (4) |
|---|---|---|
| Survival | $15k | $28k |
| Comfortable | $29k | $42k |
| Luxury | $96k+ | $148k+ |
| Elite (Top 5%) | $113k+ | $175k+ |
125%
The Area Signal
A metric tracking the socioeconomic signals of the area.
Hobbies
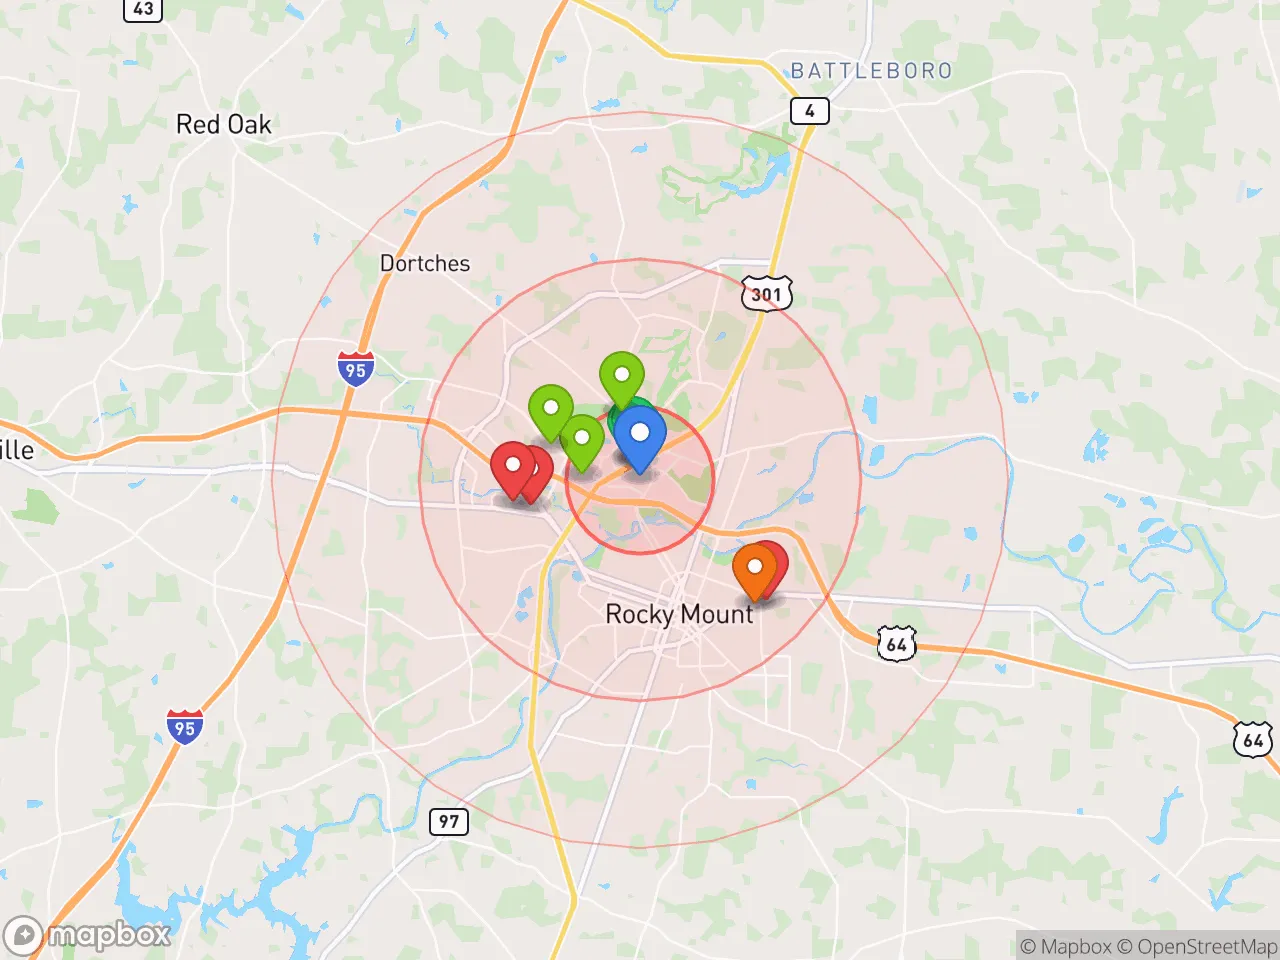
Explore the areaGroceries
8 within 10 miles
Gas
20 within 10 miles
Hospital
4 within 20 miles
Airport
RDU — Raleigh–Durham International
Post Office
USPS — Rocky Mount, NC
Critical Amenities
Quality-of-Life Analysis
Rocky Mount, North Carolina, presents a notably affordable quality of life, with a cost of living index of 68—well below the national average of 100—making it one of the more budget-friendly mid-sized cities in the state. The area attracts a mix of working-class families, retirees on fixed incomes, and young professionals drawn to nearby employment hubs like Nash Community College and the CSX intermodal terminal. While the city’s median household income of roughly $38,000 trails the national median, the low housing costs and short commutes offset this gap, creating a practical environment for those prioritizing financial stability over high earnings.
Cost of living, housing, and affordability compared to Raleigh and Greenville
Rocky Mount’s housing market is a standout feature: the median home value sits at $148,300, and the median rent is $919 per month—both roughly half of what you would pay in Raleigh (median home value ~$380,000) or Greenville, NC (~$210,000). The cost of living index of 68 means groceries, utilities, and healthcare are also significantly cheaper than the U.S. norm. For example, a gallon of milk averages $3.20 versus $4.00 nationally, and a monthly energy bill for a 900-square-foot apartment runs about $120. The average commute of 21.4 minutes is shorter than the national average of 26 minutes, reducing transportation costs and freeing up time for residents. Property taxes in Edgecombe County (where part of Rocky Mount lies) are moderate at roughly 0.85% of assessed value, while Nash County’s rate is slightly higher at 0.92%—still well below Wake County’s 1.05%.
What daily life is like for families: schools, amenities, and local rhythm
Daily life in Rocky Mount revolves around a slower, more community-oriented pace than the Triangle’s fast growth. The city’s public schools, part of the Nash-Rocky Mount school district, include Rocky Mount High School and Nash Central High School, both of which have graduation rates around 80%—below the state average of 87% but improving with recent investments in career and technical education. For recreation, the Rocky Mount Sports Complex offers 12 baseball/softball fields and a 50,000-square-foot indoor facility, while the Rocky Mount Mills development on the Tar River provides a brewery, event space, and walking trails. The city’s downtown has seen revitalization, with the Imperial Centre for the Arts and Sciences housing a museum, planetarium, and theater. Healthcare access is solid via Nash UNC Health Care, a 300-bed hospital with a Level III trauma center. Residents typically drive 10–15 minutes to reach grocery stores, pharmacies, and chain restaurants, with most errands concentrated along U.S. 64 and U.S. 301.
Rocky Mount is best suited for those who value low housing costs, short commutes, and a slower lifestyle over urban amenities and high-paying job markets. Retirees on fixed incomes, remote workers seeking a low-cost base within an hour of Raleigh, and families who prioritize affordability over school rankings will find the city practical. However, professionals in tech or finance may find the local job market limited, with median wages around $35,000—roughly 30% below the national median. For budget-conscious movers who can tolerate a quieter social scene and moderate school performance, Rocky Mount offers a stable, low-stress foundation.
Crime in Rocky Mount, NC
Significantly higher crime rates than 80% of comparable U.S. locations.
Violent CrimeViolent Crime Analysis
Property CrimeProperty Crime Analysis
Crime Analysis
Rocky Mount, North Carolina, reports a violent crime rate of 299.4 per 100,000 residents and a property crime rate of 1,659.9 per 100,000, placing it above both state and national averages for property offenses. While not among the most dangerous cities in the state, these figures indicate a community where property crime is a more pressing concern than violent crime. The overall safety picture is mixed, with residents and visitors advised to exercise standard urban precautions, particularly regarding vehicle and home security.
Crime in context
Rocky Mount’s violent crime rate of 299.4 per 100,000 is roughly 20% lower than the national average of approximately 380 per 100,000, but its property crime rate of 1,659.9 per 100,000 is nearly 30% higher than the national average of about 1,280 per 100,000. Compared to North Carolina’s statewide property crime rate of roughly 1,450 per 100,000, Rocky Mount’s figure is elevated. The city’s location within the larger Rocky Mount-Wilson-Roanoke Rapids Combined Statistical Area means it shares crime patterns common to mid-sized Southern cities—concentrated in specific corridors—rather than the diffuse, high-density crime of a major metro like Charlotte or Raleigh. However, as part of a region with progressive judicial leadership in some neighboring counties, residents should be aware that lenient sentencing policies can reduce deterrence and contribute to repeat property offenses, a dynamic that directly impacts local safety.
What residents experience
Daily life in Rocky Mount involves a tangible awareness of property crime. Vehicle break-ins, package theft, and residential burglary are the most commonly reported incidents, often occurring in areas near major thoroughfares like US-64 and I-95. Violent crime, while less frequent, is not random—it tends to involve individuals who know each other and is concentrated in a few specific neighborhoods. Residents in single-family home districts report feeling safe during the day but take precautions at night, such as locking cars and using outdoor lighting. The city’s police department has implemented community policing initiatives and crime mapping tools, but clearance rates for property crimes remain low, a pattern consistent with under-resourced departments nationwide. For families and retirees, the practical takeaway is that Rocky Mount requires vigilance but is not a high-risk environment for violent victimization.
Neighborhood-level variation
Safety in Rocky Mount varies significantly by neighborhood. The West Mount area and areas near Nash Community College generally report lower crime rates, while downtown and corridors along Raleigh Road and Sunset Avenue see higher concentrations of property crime and occasional violent incidents. The city’s historic districts, such as the Villa Place and West Haven neighborhoods, benefit from active neighborhood watch programs and higher homeownership rates, which correlate with lower crime. Prospective residents should consult the Rocky Mount Police Department’s online crime map and visit neighborhoods at different times of day to assess their comfort level. Given the regional context of progressive prosecutorial policies that may reduce consequences for repeat offenders, choosing a neighborhood with strong community engagement and visible police presence is a prudent strategy for minimizing risk.
* Values derived from national, state, county, city and local statistics and may differ in a specific area. Last updated: 2026-05-03T20:28:24.000Z
Narrative content on this page is AI-generated and may contain mistakes. Verify any details that matter before acting on them.
ReloMaps may earn a commission from affiliate links at no extra cost to you.