Photo: Wikipedia
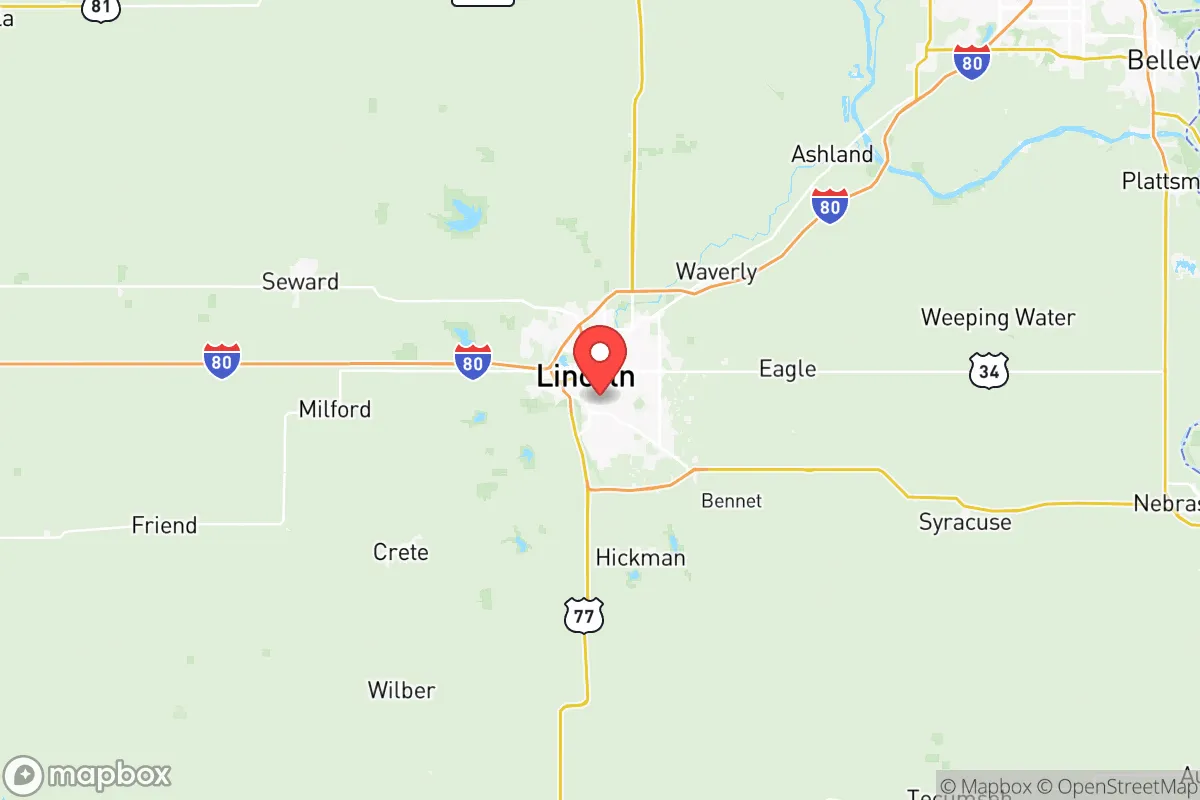
Demographics of Lancaster County
Affluence Level in Lancaster County
A middle-class area roughly in line with national averages across income, home values, education, and employment.
People of Lancaster County
Lancaster County, Nebraska, is today a predominantly white, college-educated, and politically moderate-to-conservative community of 323,673 residents, anchored by the state capital of Lincoln. The county’s population is notably less diverse than the national average, with 78.7% identifying as white, 8.2% as Hispanic, 3.7% as Black, 3.4% as East/Southeast Asian, and 0.6% as Indian (subcontinent). Its character is shaped by a deep-rooted agricultural heritage, a strong state-government and university presence, and a steady but measured influx of domestic and international migrants that has not fundamentally altered its Midwestern, family-oriented identity.
Settlement & growth (pre-1960)
Before American settlement, the area now known as Lancaster County was part of the traditional territory of the Pawnee, Otoe, and Omaha nations, who used the region for seasonal hunting and trade along the Salt Creek and Platte River corridors. The first permanent non-Native settlers arrived in the 1850s, following the passage of the Kansas-Nebraska Act in 1854, which opened the territory to homesteading. The earliest wave was overwhelmingly of Yankee and Mid-Atlantic origin—farmers from New York, Ohio, and Pennsylvania—who claimed land under the Preemption Act and later the Homestead Act of 1862. They founded the village of Lancaster in 1856, which was renamed Lincoln in 1867 when it became the state capital, a decision driven by political maneuvering to locate the capital in the more populous eastern part of the state.
From the 1870s through the 1910s, a second major wave arrived: German and Czech immigrants, drawn by cheap land and the promise of agricultural prosperity. Germans settled heavily in the northern and western parts of the county, founding communities like Waverly and Raymond, while Czechs concentrated in the southern areas, establishing Malcolm and Denton. These groups brought distinct religious and cultural traditions—Lutheran and Catholic churches, Czech-language newspapers, and fraternal societies—that persisted for generations. By 1900, Lancaster County was over 95% white, with the foreign-born population peaking at around 20%, mostly from Germany and the Austro-Hungarian Empire.
The early 20th century saw a smaller but notable influx of Swedish and Danish immigrants, who settled in and around Hickman and Firth, contributing to the county’s agricultural economy. The Dust Bowl and Great Depression of the 1930s brought a wave of Oklahoma and Arkansas migrants—often called "Okies"—who moved into Lincoln and the surrounding towns seeking work in the city’s growing manufacturing and government sectors. World War II accelerated this urbanization, as Lincoln’s military and industrial base expanded, drawing rural Nebraskans and out-of-state workers alike. By 1960, the county’s population had reached 155,272, with Lincoln absorbing the vast majority of growth, while the smaller towns remained stable or declined slightly.
Modern era (post-1965)
The 1965 Hart-Cellar Act fundamentally reshaped Lancaster County’s demographics, though the changes were slower and less dramatic than in coastal or Sun Belt regions. The first significant post-1965 immigrant group was Vietnamese refugees, who began arriving in the late 1970s and 1980s, resettled by church and nonprofit sponsors. They concentrated in central and south Lincoln, particularly around the University of Nebraska-Lincoln campus and the South 27th Street corridor, where a small but visible Vietnamese business district emerged. Today, the East/Southeast Asian population stands at 3.4%, with Vietnamese and Chinese families forming the largest subgroups.
Hispanic migration to Lancaster County began in earnest in the 1990s, driven by agricultural labor demand in the surrounding corn and soybean fields, as well as construction and meatpacking jobs in Lincoln. The Hispanic population grew from under 2% in 1990 to 8.2% by 2024, with the largest concentrations in north Lincoln and the working-class neighborhoods around West O Street. Unlike in many Great Plains counties, this growth has been steady rather than explosive, and the community is predominantly Mexican-American, with smaller numbers of Guatemalan and Salvadoran families.
Domestic migration has been a more powerful demographic force than international immigration. Since the 1980s, Lancaster County has attracted a steady stream of Rust Belt retirees and professionals from Illinois, Michigan, and Ohio, drawn by lower taxes, affordable housing, and a slower pace of life. This in-migration has been especially pronounced in the suburban towns of Eagle, Bennet, and Panama, where new subdivisions have sprouted on former farmland. The county’s college-educated share—now 41.1%—has risen sharply since 2000, driven by the University of Nebraska-Lincoln’s expansion and the growth of state-government and insurance-sector jobs. The Black population, at 3.7%, remains modest and is largely concentrated in Lincoln’s Near South and Clinton neighborhoods, with roots in the post-World War II Great Migration and later professional relocations.
The future
Lancaster County is likely to continue its gradual diversification, but the pace will remain slow compared to national trends. The Hispanic population is projected to grow to 12-14% by 2040, driven by higher birth rates and continued immigration, while the East/Southeast Asian and Indian populations will likely plateau around 4-5% each, as the university and tech sectors attract a modest but steady stream of skilled workers. The white population, while declining as a share, will remain the overwhelming majority, and the county’s cultural identity—rooted in Midwestern pragmatism, Evangelical Christianity, and a strong work ethic—will persist.
The most significant demographic shift may be internal: the suburbanization of Lincoln’s growth into towns like Waverly and Hickman, which are becoming commuter suburbs for young families seeking larger lots and lower taxes. This trend is reinforcing the county’s conservative lean, as these outlying areas vote heavily Republican, while Lincoln itself remains a moderate-to-liberal island. The county is not tribalizing into distinct ethnic enclaves; rather, immigrant groups are slowly assimilating into the broader community, with second-generation Hispanics and Vietnamese increasingly moving to mixed neighborhoods and attending the same schools.
For someone moving to Lancaster County now, the bottom line is this: you are entering a stable, predominantly white, family-oriented community that is diversifying at a measured pace, not a revolutionary one. The county offers a low-cost, low-crime, high-amenity lifestyle anchored by a strong state capital and university, with a political culture that leans conservative in the suburbs and moderate in the city. The people are welcoming but not rapidly changing—a place where tradition and stability still define daily life.
* Values derived from national, state, county, city and local statistics and may differ in a specific area. Last updated: 2026-05-12T08:57:47.000Z
Narrative content on this page is AI-generated and may contain mistakes. Verify any details that matter before acting on them.
ReloMaps may earn a commission from affiliate links at no extra cost to you.