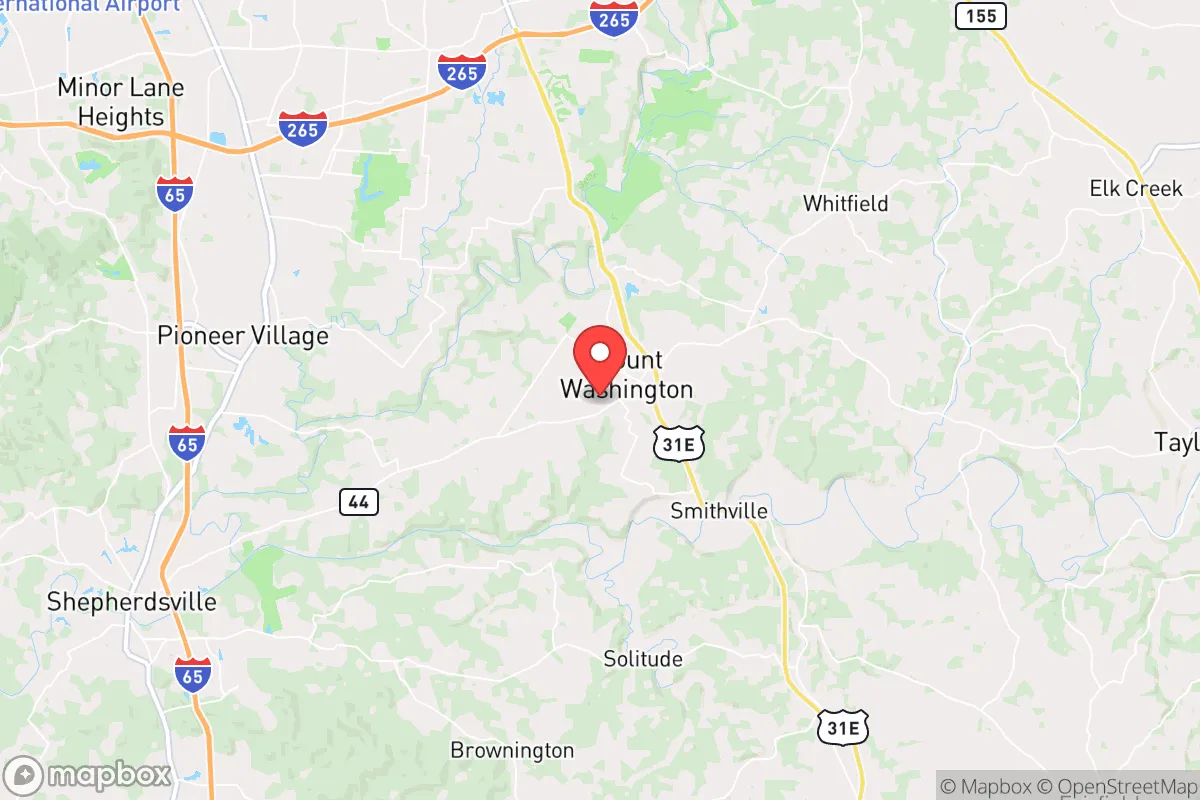
Demographics of Mount Washington, KY
Affluence Level in Mount Washington, KY
A middle-class area roughly in line with national averages across income, home values, education, and employment.
People of Mount Washington, KY
Mount Washington, Kentucky, is a predominantly white, family-oriented city of 18,228 residents that has transformed from a quiet railroad depot into a fast-growing exurban hub for Louisville commuters. With a population that is 91.8% white and a foreign-born share of just 1.4%, the city retains a strong cultural homogeneity that appeals to conservative-leaning families seeking affordable housing and a small-town atmosphere. The city’s identity is rooted in its historic role as a stop on the Louisville and Nashville Railroad, and its modern character is defined by rapid suburban expansion, low crime, and a civic life centered around churches, youth sports, and local festivals.
How the city was settled and grew
Mount Washington’s original population arrived in the early 19th century, drawn by land grants issued to veterans of the American Revolution and the War of 1812. The city was formally established in 1822 as a stagecoach stop along the Bardstown Turnpike, and its early settlers were predominantly of English, Scots-Irish, and German descent from the Upper South. The arrival of the Louisville and Nashville Railroad in the 1850s turned the village into a shipping point for tobacco, livestock, and timber, attracting merchants and tradesmen who built homes in the Historic Downtown District around Main Street and Cross Main Street. By the early 1900s, the population hovered around 500, with a small African American community concentrated in the Southside area near the railroad tracks, though that community had largely dispersed by the mid-20th century due to outmigration and the lack of industrial employment. The city remained a sleepy farming center until the post-World War II era, when improved roads and the rise of automobile commuting began to pull in families from Louisville.
Modern era (post-1965)
The modern population boom began in earnest after the 1965 Immigration and Nationality Act, though Mount Washington saw virtually no international immigration. Instead, the city’s growth was driven by domestic white flight from Louisville and the expansion of Interstate 65, which made the 25-mile commute to downtown Louisville feasible. The 1970s and 1980s saw the development of the Whitney Estates and Woodland Hills subdivisions, which attracted young families seeking larger lots and lower property taxes than Jefferson County. By 1990, the population had reached 4,500, and the city’s racial composition was over 98% white. The 2000s and 2010s brought a second wave of suburbanization, with the construction of the Lake Forest and Hunter’s Ridge neighborhoods, which absorbed middle-class families from Louisville’s East End and southern Indiana. The Hispanic population, now at 3.6%, began to grow slowly after 2010, primarily through service-sector workers settling in rental properties near the Bardstown Road corridor south of downtown. The East/Southeast Asian population (0.4%) and Indian subcontinent population (0.3%) remain tiny, consisting mostly of professionals employed at the nearby Ford Louisville Assembly Plant or at Norton Healthcare facilities in Louisville. The Black population is recorded at 0.0%, reflecting the city’s near-total absence of African American residents—a demographic reality that distinguishes Mount Washington from more diverse Bullitt County towns like Shepherdsville.
The future
Mount Washington’s population is projected to continue growing at a steady pace, driven by ongoing residential development in the Northridge Farms and Briarwood subdivisions, which are targeting families priced out of Louisville’s East End. The city is likely to remain overwhelmingly white and native-born, as the low foreign-born share (1.4%) shows no signs of significant increase—there is no established immigrant community to anchor chain migration, and the local economy (dominated by construction, retail, and healthcare) does not attract the high-skilled immigration seen in larger metros. The Hispanic share may rise modestly as construction and landscaping workers settle in, but the city’s zoning laws and high homeownership rates (above 75%) limit rental housing stock that typically attracts new immigrant populations. The college-educated share (25.0%) is below the national average, reflecting the city’s blue-collar and service-sector employment base, though this may rise slowly as remote workers from Louisville move in. The city is not tribalizing into distinct ethnic enclaves—it is homogenizing further, with new subdivisions drawing almost exclusively white families from neighboring counties. For a conservative-leaning mover, Mount Washington offers a stable, culturally cohesive environment where the population is growing but not diversifying, and where the social fabric remains centered on church, school, and family networks.
Mount Washington is becoming a denser, more suburban version of its historic self—a white, middle-class bedroom community where growth is measured in rooftops rather than cultural change. For someone moving in now, the city offers a predictable, low-crime environment with strong schools and a clear sense of local identity, but little ethnic or economic diversity. The next decade will likely see continued expansion of single-family subdivisions, a slight uptick in Hispanic residents, and no meaningful change in the city’s racial or immigrant makeup.
* Values derived from national, state, county, city and local statistics and may differ in a specific area. Last updated: 2026-04-21T09:11:09.000Z
Narrative content on this page is AI-generated and may contain mistakes. Verify any details that matter before acting on them.
ReloMaps may earn a commission from affiliate links at no extra cost to you.