
Photo: Wikipedia
Demographics of Lancaster, PA
Affluence Level in Lancaster, PA
A below-average socioeconomic profile. Incomes, home values, and educational attainment trail the U.S., with higher poverty and unemployment.
People of Lancaster, PA
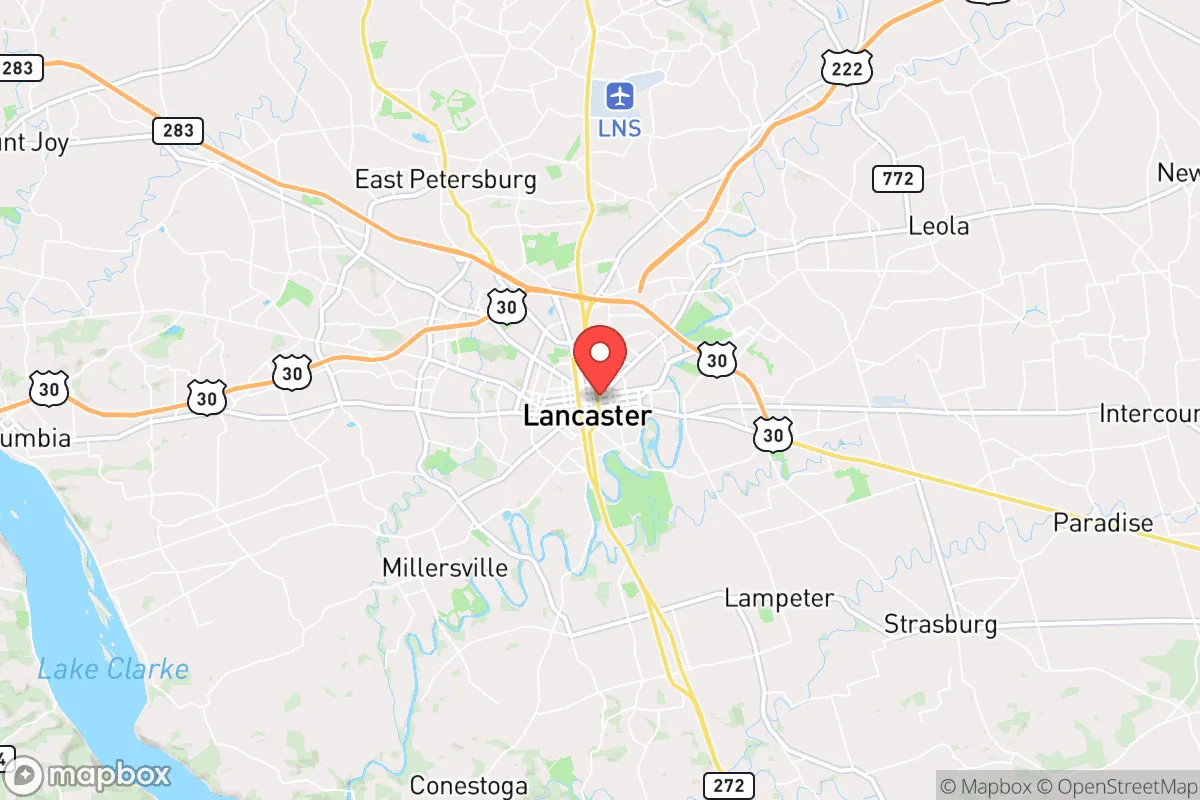
The people of Lancaster, Pennsylvania today form a 57,683-person city that is one of the most ethnically diverse in the state, yet retains a distinctly small-town, family-oriented character. The population is 38.2% White, 42.8% Hispanic, 12.2% Black, and 2.5% East/Southeast Asian, with a foreign-born share of 6.5% and a college-educated rate of 27.1%. This is not a transient or elite city — it is a working-class, multiethnic community where old Pennsylvania German roots mix with newer Latino and African American arrivals, creating a dense, walkable urban core surrounded by stable residential neighborhoods.
How the city was settled and grew
Lancaster was founded in 1730 on land originally inhabited by the Susquehannock people, and by the 1740s it was a major market town for Pennsylvania German (Deitsch) farmers. These German-speaking settlers — Mennonites, Amish, Lutherans, and Reformed — built the city’s earliest neighborhoods, including Cabbage Hill (now part of the Southeast Side) and the Historic District around Penn Square, where their stone houses and churches still stand. By the early 1800s, Lancaster had become the largest inland city in the American colonies, fueled by trade in wheat, iron, and textiles. Irish and English immigrants arrived in the 1840s-1850s to work in the city’s factories and railroads, settling in West End and Northeast Lancaster. The late 19th century brought Italian and Eastern European immigrants, who clustered in the Musser Park and Southwest Lancaster neighborhoods, working in the booming cigar, watch, and silk industries. By 1900, Lancaster was a dense, industrial city of about 41,000, overwhelmingly White and native-born, with a small Black population concentrated near the railroad yards.
Modern era (post-1965)
The 1965 Hart-Celler Act and subsequent waves of immigration reshaped Lancaster’s population dramatically. The most transformative shift began in the 1980s and 1990s, when Puerto Rican and Dominican families moved into Southeast Lancaster (including Cabbage Hill and the area around South Duke Street), drawn by factory jobs and lower housing costs. By 2000, the Hispanic share had risen to over 30%, and by 2024 it reached 42.8%, making Lancaster a majority-minority city. The Black population, which had been around 8% in 1970, grew to 12.2% by 2024, with many families settling in Northeast Lancaster and the Strawberry Hill area. East/Southeast Asian communities — primarily Vietnamese and Korean — arrived in smaller numbers after 1975, concentrated in the West End and near the Lancaster General Hospital campus. The White population, which was over 80% in 1970, fell to 38.2% by 2024, driven by suburban flight to townships like Manheim and East Hempfield. The city’s foreign-born share (6.5%) is modest compared to national averages, but the Hispanic growth has been almost entirely domestic migration from other U.S. cities and Puerto Rico, not direct immigration.
The future
Lancaster’s population is heading toward a continued Hispanic majority, with the White share likely to fall below 35% by 2035. The city is not homogenizing — rather, it is tribalizing into distinct enclaves: Southeast Lancaster is overwhelmingly Hispanic and working-class, Northeast Lancaster is mixed Black and White with a growing Hispanic presence, and the Historic District and West End remain predominantly White and more affluent. The East/Southeast Asian population is stable but small (2.5%), and the Indian-subcontinent population is negligible (0.3%), so no major Asian growth is expected. The college-educated share (27.1%) is rising slowly as young professionals move into renovated rowhomes near downtown, but the city remains a blue-collar hub. The biggest wildcard is whether Hispanic families will assimilate into the broader civic culture or remain in a separate socioeconomic track — early indicators suggest a mix, with rising homeownership but persistent income gaps. For a conservative-leaning mover, Lancaster offers a dense, walkable, family-oriented city with strong churches, low crime relative to similar-sized cities, and a population that values stability over rapid change.
Lancaster is becoming a Hispanic-majority, working-class city with a stable White minority and a small but established Black community. For someone moving in now, the key takeaway is that this is not a gentrifying or transient city — it is a place where families put down roots, neighborhoods have distinct identities, and the pace of change is slow enough that a newcomer can integrate without feeling overwhelmed. The city’s future is more Latino, more family-centered, and more locally oriented, with a character that remains deeply grounded in its Pennsylvania German and industrial past.
* Values derived from national, state, county, city and local statistics and may differ in a specific area. Last updated: 2026-05-02T01:19:40.000Z
Narrative content on this page is AI-generated and may contain mistakes. Verify any details that matter before acting on them.
ReloMaps may earn a commission from affiliate links at no extra cost to you.