Photo: Wikipedia
Demographics of Greenwood, MS
Affluence Level in Greenwood, MS
A low-income area with significant economic hardship. Household wealth and educational attainment are well below national averages.
People of Greenwood, MS
The people of Greenwood, Mississippi today form a predominantly Black community (70.6%) with a White minority of 24.7%, living in a city of 13,983 that is notably less diverse than the national average. The foreign-born population sits at just 0.6%, and Hispanic residents make up 2.9%, while East/Southeast Asian and Indian-subcontinent communities each account for less than 1%. With a college-educated rate of 23.5%, Greenwood’s population is characterized by deep generational roots, a strong sense of place, and a demographic profile that has been shaped by the cotton economy, the Great Migration, and decades of outmigration.
How the city was settled and grew
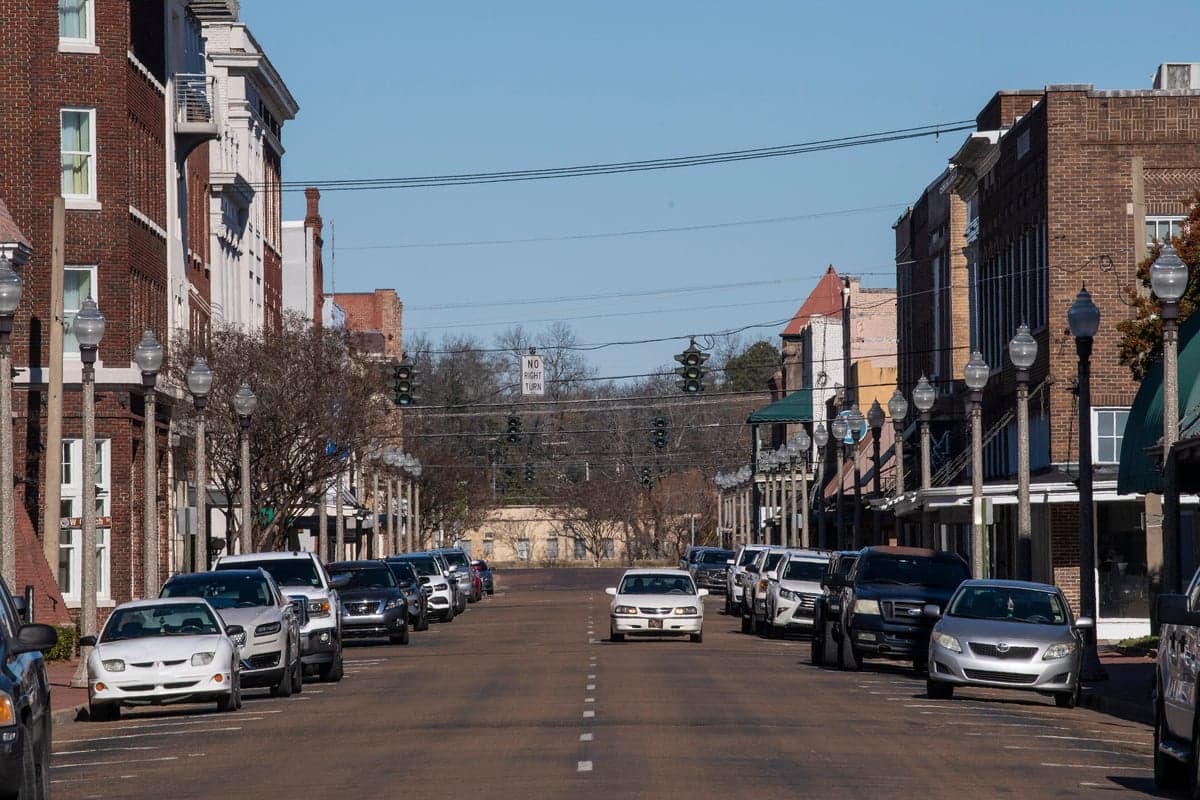
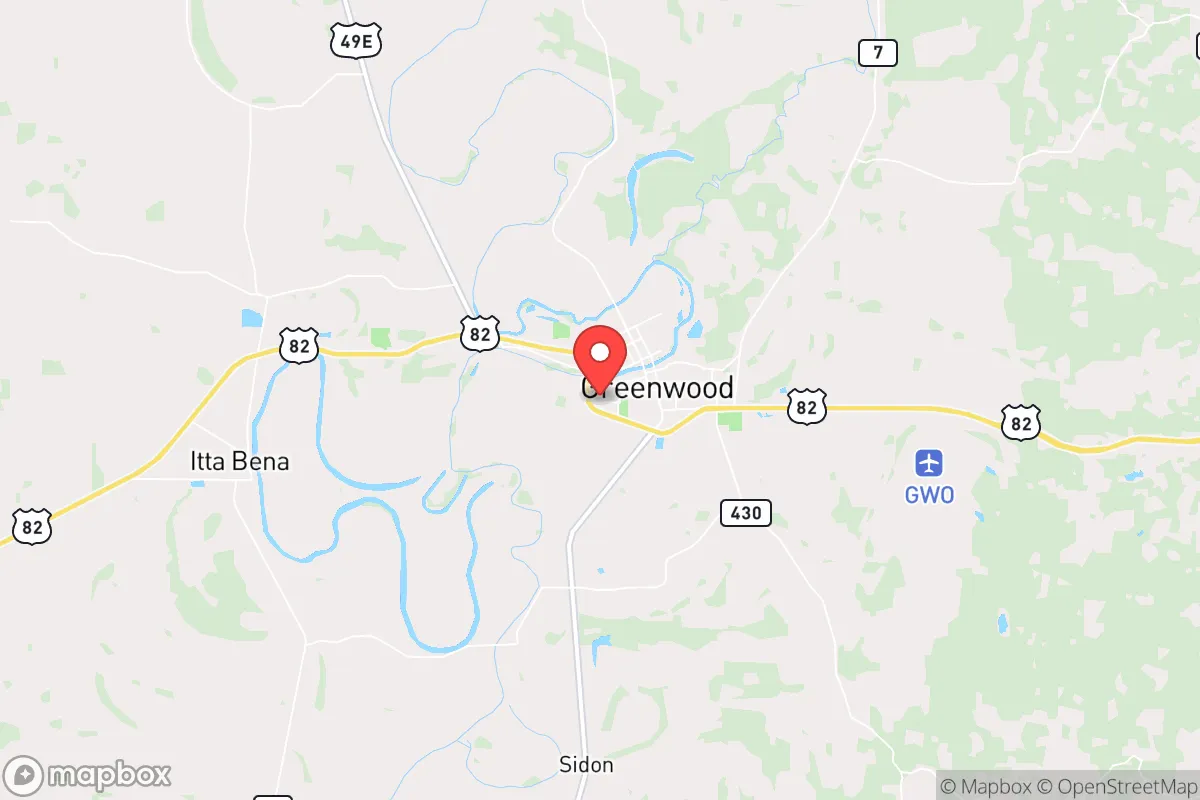
Greenwood was founded in 1834 as a trading post on the Yazoo River, but its population boom came after the Civil War, driven by the expansion of cotton plantations. The original White settlers were largely Anglo-American planters from the Upper South, who brought enslaved Black laborers to work the fertile Delta soil. After emancipation, many formerly enslaved people remained in the area as sharecroppers and tenant farmers, forming the foundation of Greenwood’s Black population. By the early 1900s, the city had become a major cotton-processing center, drawing additional Black workers from across the Mississippi Delta. These families settled in neighborhoods like Baptist Town and Riverside, which remain predominantly Black to this day. A small wave of Jewish immigrants, primarily from Eastern Europe, arrived between 1880 and 1920 to work as merchants and cotton factors, establishing a community centered around Historic Downtown Greenwood and the area near the Leflore County Courthouse. Chinese immigrants, brought in as laborers after Reconstruction, also formed a tight-knit enclave, with many opening grocery stores in the Broad Street district.
Modern era (post-1965)
The post-1965 era in Greenwood was defined by the continuation of the Great Migration, as tens of thousands of Black residents left the Delta for Northern and Western cities, reducing the city’s population from a peak of roughly 22,000 in 1960 to its current 13,983. White flight accelerated after the Civil Rights Movement and school desegregation, with many White families moving to the North Greenwood area or leaving the city entirely for suburbs like Carrollton. The Jewish community, once numbering several hundred, shrank to a handful of families as younger generations moved to larger cities. The Chinese community similarly contracted, with many descendants assimilating into the broader population or relocating. The foreign-born population remains negligible at 0.6%, reflecting the Delta’s limited appeal to international immigrants. Today, Baptist Town and Riverside remain overwhelmingly Black and lower-income, while North Greenwood is majority White and more affluent. The Historic Downtown area has seen some reinvestment but remains a commercial rather than residential hub.
The future
Greenwood’s population is projected to continue its slow decline, with outmigration of young adults and a high median age among remaining residents. The city is not homogenizing into a single identity but rather tribalizing into distinct enclaves: Baptist Town and Riverside remain deeply Black and economically distressed, while North Greenwood is increasingly White and older. The Hispanic share (2.9%) is growing slowly, driven by a small number of agricultural and service-sector workers, but remains far below state and national averages. The East/Southeast Asian and Indian-subcontinent communities are stable but tiny, with no signs of significant growth. The college-educated rate of 23.5% is below the national average, and the city struggles to retain its educated youth, who often leave for Jackson, Memphis, or Atlanta. The next 10-20 years will likely see further population contraction, with the Black majority remaining dominant but aging, and the White minority concentrating in a few neighborhoods.
For someone moving into Greenwood now, the city offers a deeply rooted, historically rich community with clear neighborhood identities. The population is stable in its composition but shrinking overall, meaning new residents will find a tight-knit environment where local institutions—churches, schools, and civic groups—still anchor daily life. The low foreign-born share and minimal ethnic diversity mean that the city’s social fabric is largely defined by the Black-White dynamic, with little of the multicultural influx seen in other Southern cities. This is a place for those seeking a quiet, traditional Delta lifestyle, not for those expecting rapid growth or demographic change.
* Values derived from national, state, county, city and local statistics and may differ in a specific area. Last updated: 2026-04-30T13:22:52.000Z
Narrative content on this page is AI-generated and may contain mistakes. Verify any details that matter before acting on them.
ReloMaps may earn a commission from affiliate links at no extra cost to you.