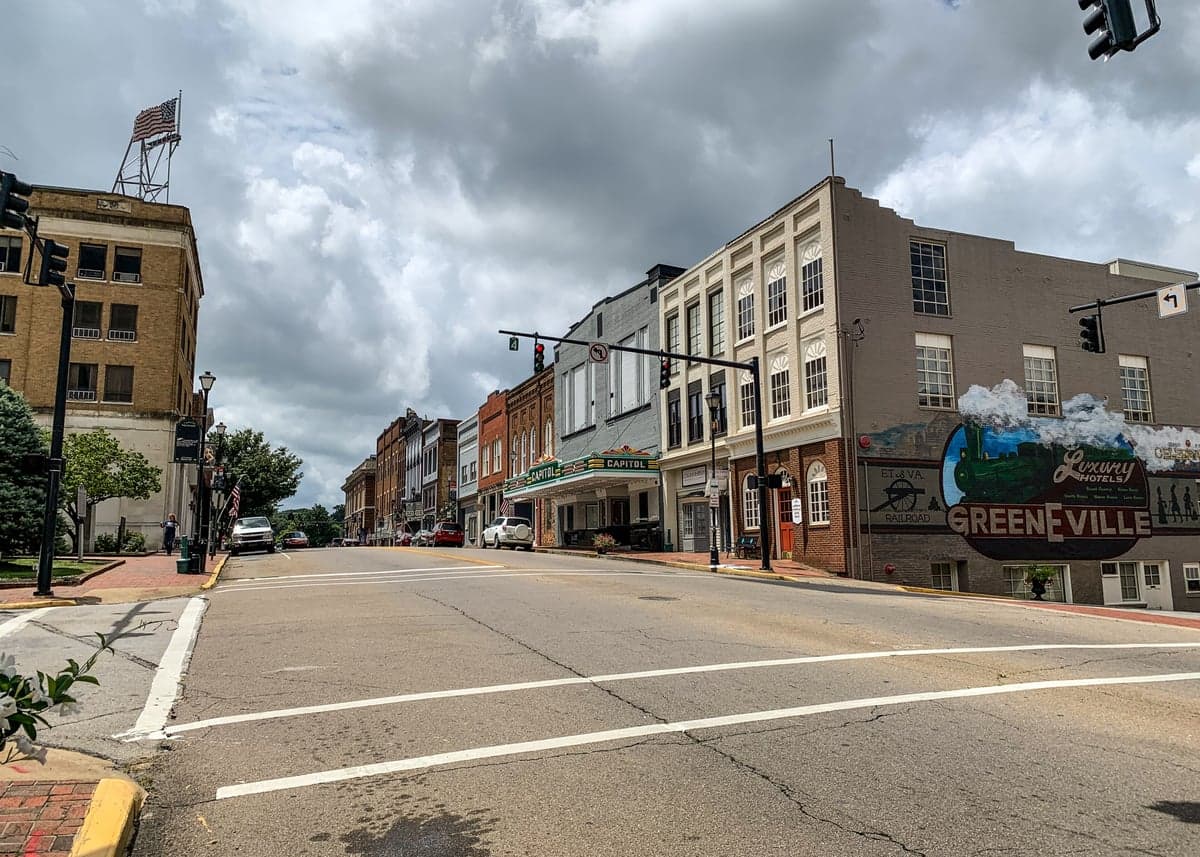
Photo: Wikipedia
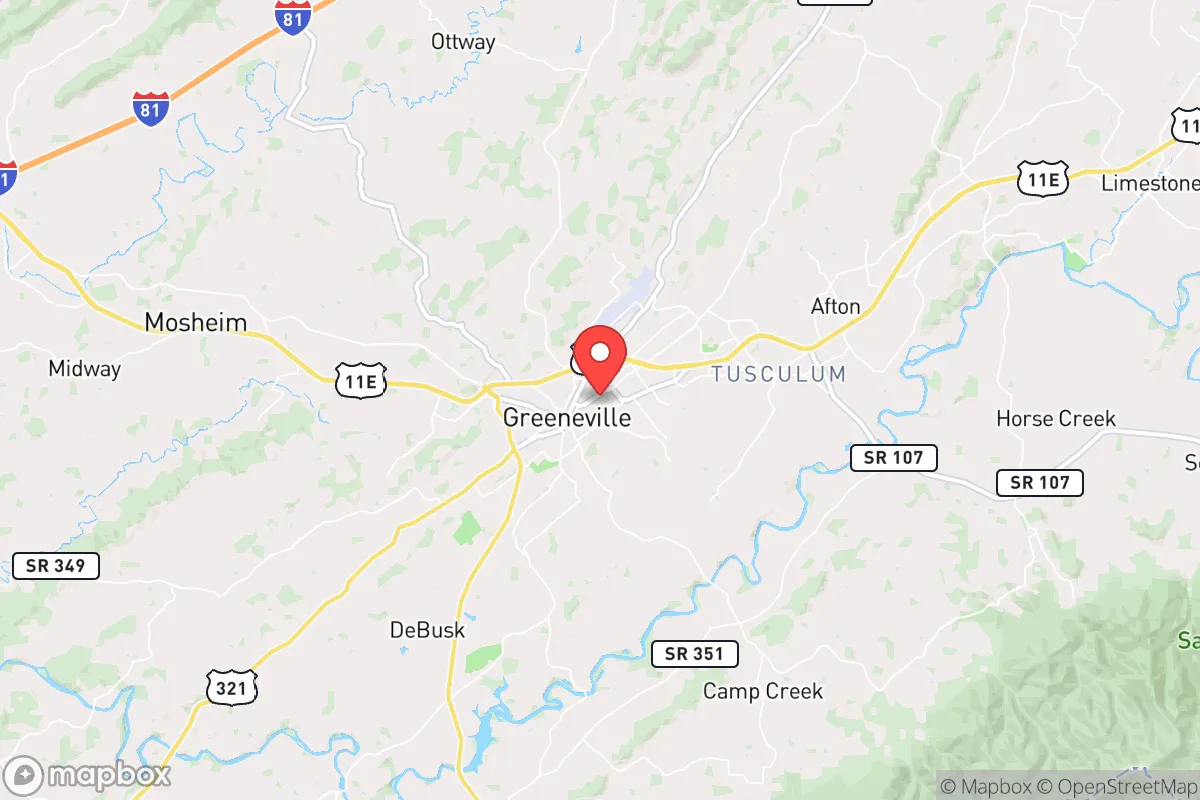
Demographics of Greeneville, TN
Affluence Level in Greeneville, TN
A below-average socioeconomic profile. Incomes, home values, and educational attainment trail the U.S., with higher poverty and unemployment.
People of Greeneville, TN
Greeneville, Tennessee, is a small city of 15,531 residents with a deeply rooted, predominantly white population (84.1%) and a modest but growing Hispanic community (7.6%). The city’s character is defined by its historic downtown, a strong sense of local tradition, and a population that is less transient than many Southern towns, with a foreign-born share of just 1.9%. For those considering a move, Greeneville offers a stable, family-oriented environment where generational ties to the land and local institutions remain strong.
How the city was settled and grew
Greeneville’s human history begins with its founding in 1783 by General Nathanael Greene, after whom the city is named, and early settlers from Virginia and North Carolina who were granted land for service in the Revolutionary War. These initial waves were overwhelmingly of Scots-Irish and English descent, drawn by the fertile Nolichucky River valley and the promise of self-sufficient farming. The original settlement clustered around what is now Downtown Greeneville, with the courthouse square becoming the civic and commercial heart. By the early 19th century, the town grew as a regional trading post and political center, famously serving as the home of President Andrew Johnson. The arrival of the railroad in the 1850s spurred a second wave of growth, attracting merchants and craftsmen who built homes in the College Hill neighborhood, known for its historic Victorian architecture and proximity to Tusculum University. Through the mid-20th century, Greeneville remained a largely homogeneous, agrarian community, with the West Side developing as a middle-class residential area for workers at local textile mills and the Magnavox plant.
Modern era (post-1965)
The post-1965 period brought only modest demographic change to Greeneville, as the city did not experience the large-scale immigration seen in major metropolitan areas. The most significant shift has been the growth of the Hispanic population, which now stands at 7.6%, up from negligible numbers in the 1990s. This community is primarily composed of Mexican and Central American families who arrived for work in agriculture (tobacco and Christmas tree farms) and light manufacturing. They have concentrated in the South Greeneville area, particularly along the corridors of Highway 11E and Snapps Ferry Road, where a small cluster of Hispanic-owned businesses and churches has emerged. The Black population (2.5%) has remained stable and historically centered in the East Greeneville neighborhood, near the former George Clem School, a segregated school that operated until 1965. The Asian population (0.5%) is very small, with families primarily working in healthcare at Ballad Health Greeneville Community Hospital or in academia at Tusculum University, and they are dispersed rather than forming a distinct ethnic enclave. The college-educated share of the population is 25.0%, reflecting the presence of Tusculum University and a growing professional class in healthcare and education, many of whom live in newer subdivisions like Briarwood and Fox Run on the city’s northern edge.
The future
Greeneville’s population is projected to remain stable and predominantly white, with gradual growth driven by domestic in-migration from other parts of Tennessee and the Midwest, attracted by lower costs and a slower pace of life. The Hispanic community is likely to continue its slow growth, potentially reaching 10-12% of the population over the next decade, but it is expected to assimilate rather than form a large, separate enclave. The city is not tribalizing into distinct ethnic neighborhoods; instead, new subdivisions are drawing a mix of residents, though the historic patterns of East Greeneville (Black) and South Greeneville (Hispanic) will persist as cultural touchpoints. The biggest demographic trend is the aging of the white population, with many younger adults leaving for job opportunities in Knoxville or Johnson City, which could slow population growth and increase the median age.
For a conservative-leaning individual or family moving to Greeneville today, the city offers a stable, safe, and culturally traditional environment. The population is overwhelmingly native-born, English-speaking, and rooted in local history, with a small but growing Hispanic community adding modest diversity. The key takeaway is that Greeneville is not a place of rapid demographic change or ethnic tension, but rather a slow-growing, family-oriented town where newcomers are expected to integrate into existing community structures. The city’s future is one of gradual, managed growth, not transformation.
* Values derived from national, state, county, city and local statistics and may differ in a specific area. Last updated: 2026-05-01T05:25:28.000Z
Narrative content on this page is AI-generated and may contain mistakes. Verify any details that matter before acting on them.
ReloMaps may earn a commission from affiliate links at no extra cost to you.