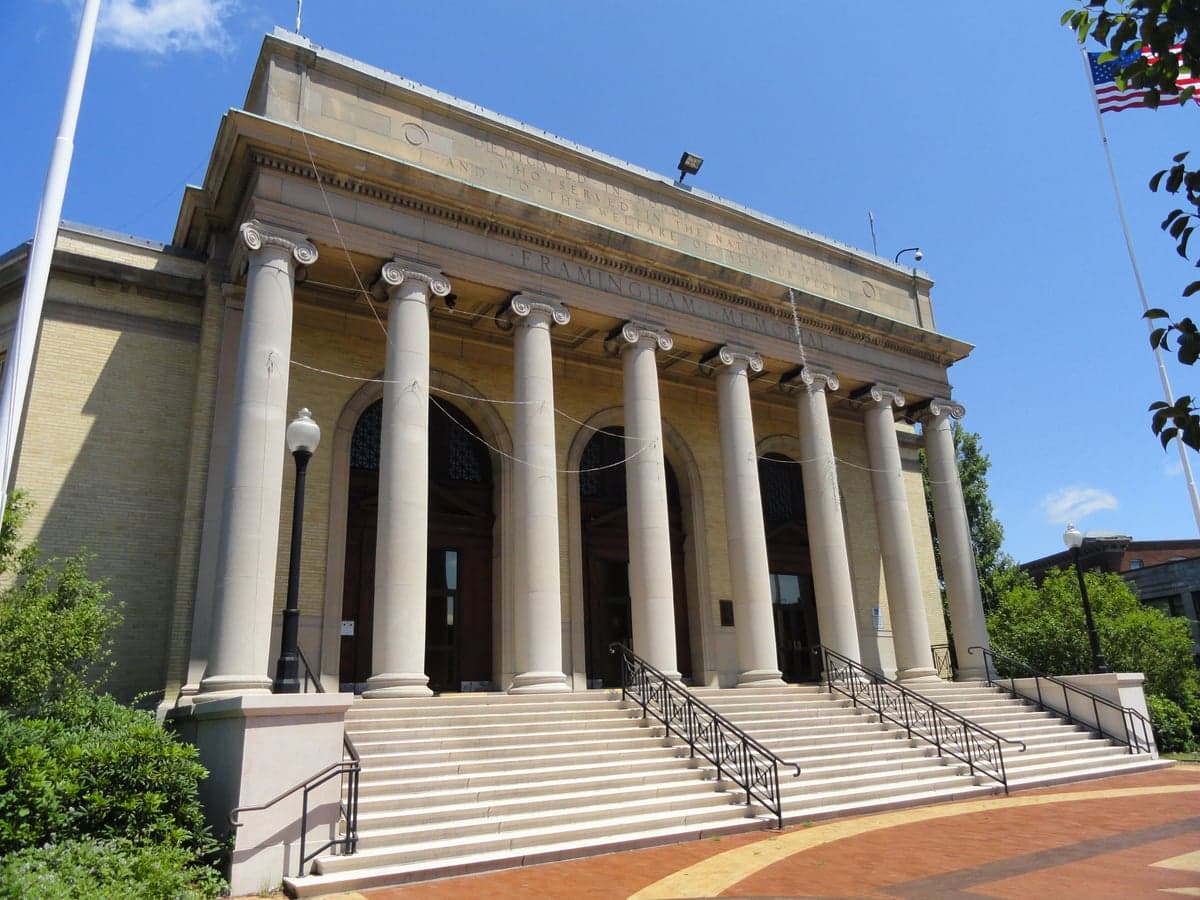
Photo: Wikipedia
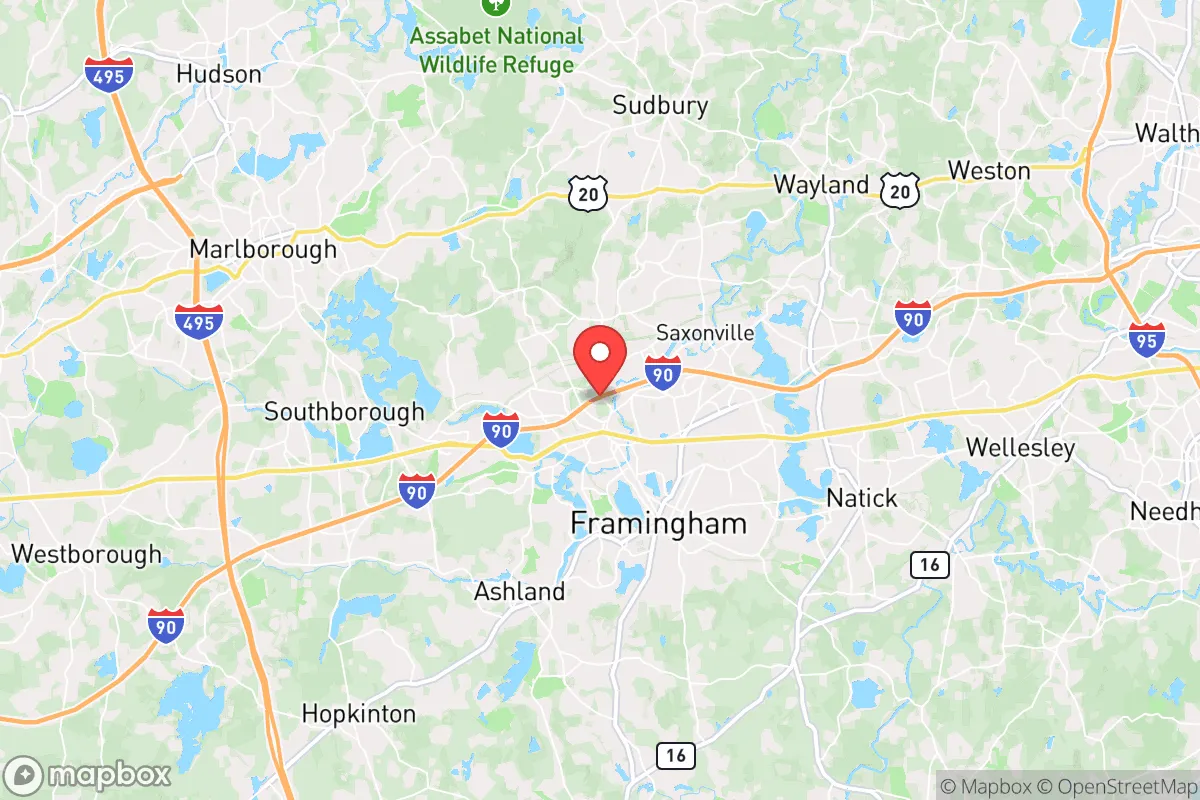
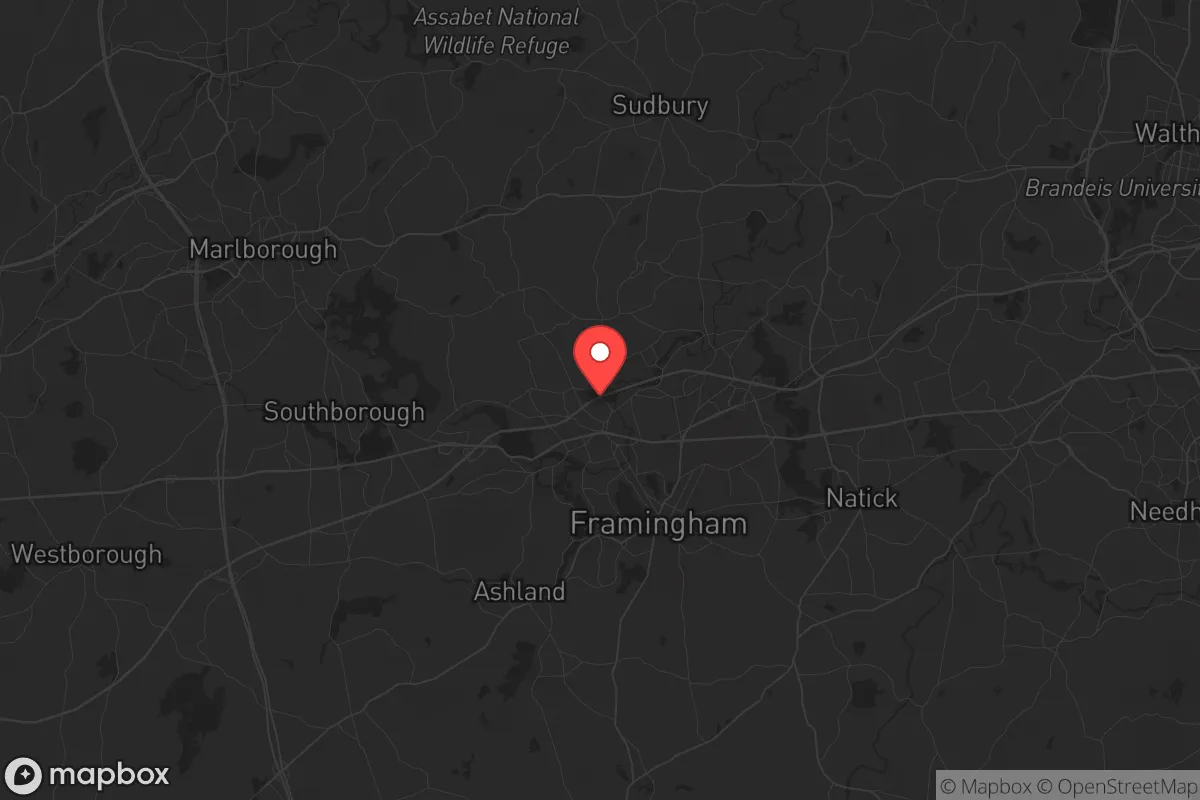
Demographics of Framingham, MA
Affluence Level in Framingham, MA
A middle-class area roughly in line with national averages across income, home values, education, and employment.
People of Framingham, MA
Framingham, Massachusetts, is a dense, diverse city of 72,013 residents where no single ethnic group holds a majority. Its character is defined by a 20.0% foreign-born population, a significant Brazilian and Portuguese-speaking community, and a growing Hispanic presence, all layered over a historic Yankee and Irish Catholic foundation. The city feels less like a traditional New England town and more like a collection of distinct ethnic enclaves, each with its own history and trajectory.
How the city was settled and grew
Framingham’s original population was English Puritan farmers, drawn by land grants from the Massachusetts Bay Colony in the 17th century. The town’s early center was along the Sudbury River in what is now Saxonville, where mills harnessed water power for grist and lumber. By the early 19th century, the arrival of the railroad and the rise of shoe and straw-hat manufacturing shifted the economic and population center to the Framingham Center and Downtown areas. Irish immigrants fleeing the Great Famine built the mills and laid the railroad tracks, settling in the working-class tenements of South Framingham (the area around the train station). They were followed by French-Canadians and Italians in the late 1800s, who took jobs in the Dennison Manufacturing Company and other factories, forming tight-knit parishes in Southside neighborhoods. By 1950, Framingham was a predominantly white, Catholic, and Democratic-voting industrial suburb, with a population of about 28,000.
Modern era (post-1965)
The 1965 Immigration and Nationality Act fundamentally reshaped Framingham’s population. The most dramatic change was the arrival of Brazilian immigrants, beginning in the 1980s and accelerating through the 2000s. They concentrated in Downtown Framingham and the Southside, transforming blocks of Concord Street and Waverly Street into a vibrant corridor of Brazilian bakeries, restaurants, and travel agencies. Today, Brazilians are the largest foreign-born group, though they are not separately counted in the census data above. The same period saw a steady influx of Hispanic immigrants, primarily from Puerto Rico, El Salvador, and Guatemala, who settled in the more affordable rental stock of Downtown and the Route 9 corridor. The Asian population (East/Southeast Asian, 4.2%) is smaller and more dispersed, with a notable cluster of Chinese and Vietnamese families in the Nobscot and Woodville neighborhoods, often drawn by the area’s good schools. The Indian-subcontinent population (3.0%) is a more recent, professional wave, many working in the tech and biotech sectors along the I-495 belt, and they tend to settle in the newer single-family homes of North Framingham and Nobscot. The white population (51.7%) has aged and shrunk, but remains dominant in the older, leafier neighborhoods like Framingham Center and Nobscot.
The future
Framingham’s population is not homogenizing; it is becoming more distinctly tribalized into ethnic and economic enclaves. The Brazilian community, now second- and third-generation, is beginning to move outward to more suburban towns like Marlborough and Hudson, but Downtown Framingham remains its commercial and cultural heart. The Hispanic share (18.7%) is growing steadily, driven by both immigration and higher birth rates, and is likely to surpass 25% within a decade. The white share will continue to decline, though the city’s older, established white residents in Framingham Center and Nobscot are not leaving en masse. The East/Southeast Asian and Indian populations are stable or slowly growing, but they are not the primary drivers of demographic change. The biggest unknown is the trajectory of the Brazilian community: if they continue to suburbanize, the city’s foreign-born share could plateau, but if new immigration from Brazil resumes, it will remain a defining feature.
For a conservative-leaning individual or family moving in now, Framingham offers a genuinely diverse, urban-suburban environment with strong schools and a robust economy, but it is not a place of cultural consensus. It is a city of distinct neighborhoods where your experience will vary sharply depending on whether you live in Nobscot, Downtown, or South Framingham. The city is becoming more Hispanic and more Brazilian, while its older Yankee and Irish Catholic base continues to age. The bottom line: Framingham is a dynamic, immigrant-driven city that rewards those who embrace its diversity, but it lacks the quiet homogeneity many conservative families seek in a suburb.
* Values derived from national, state, county, city and local statistics and may differ in a specific area. Last updated: 2026-05-01T02:57:55.000Z
Narrative content on this page is AI-generated and may contain mistakes. Verify any details that matter before acting on them.
ReloMaps may earn a commission from affiliate links at no extra cost to you.