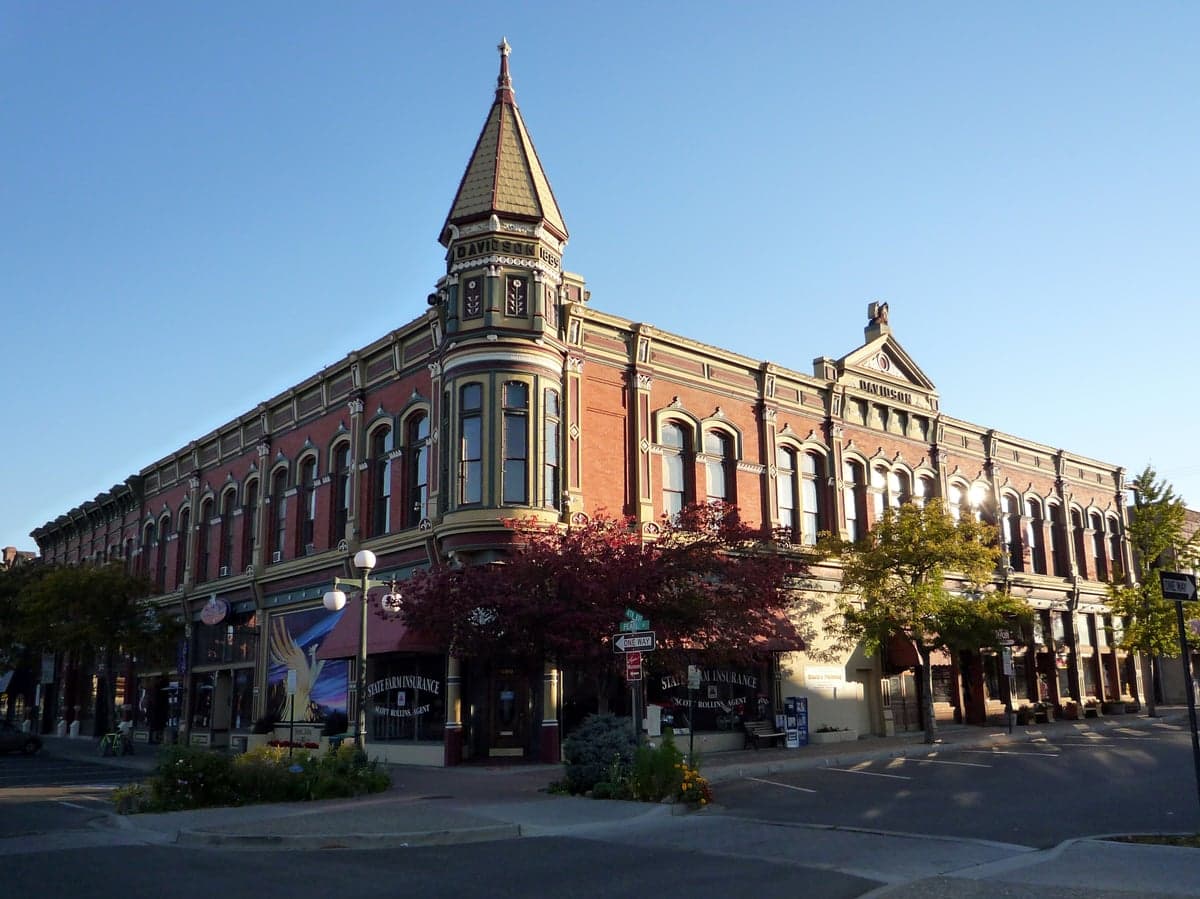
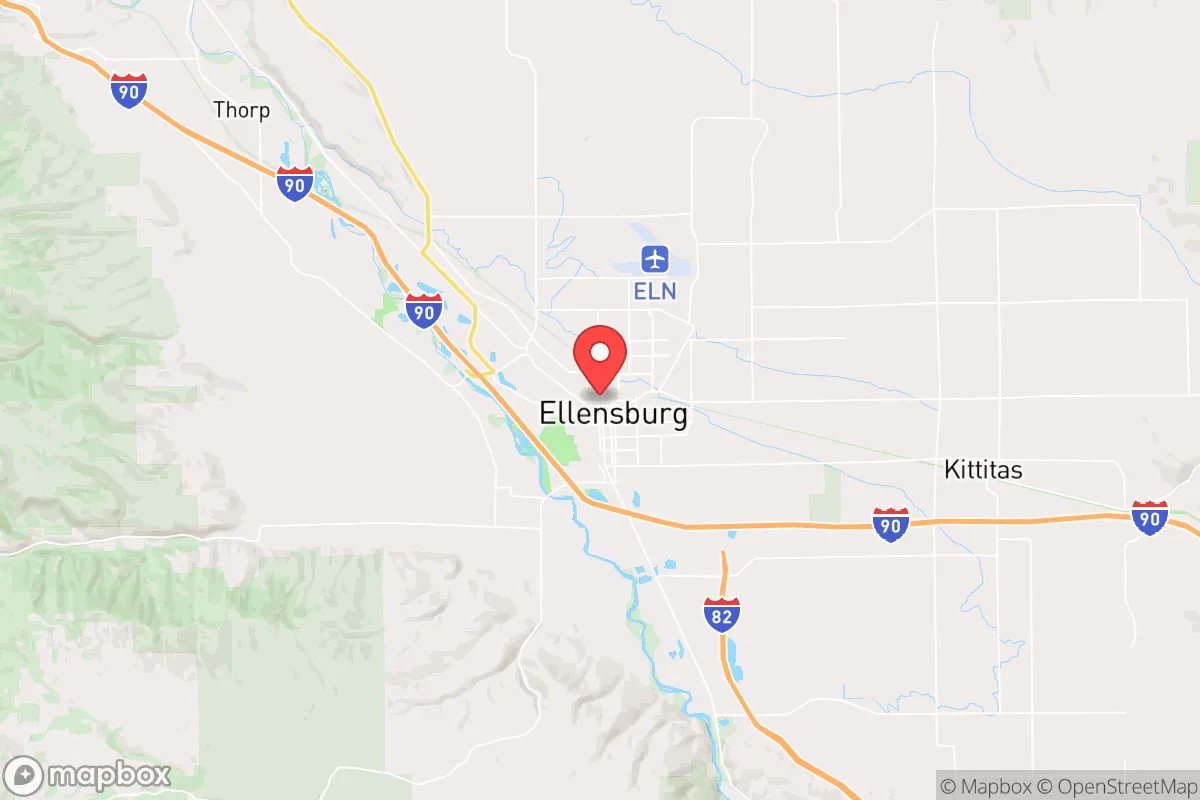
Photo: Wikipedia
Quality of Life in Ellensburg, WA
A high quality of life with strong walkability, manageable living costs, healthy neighborhood signals, and solid amenity access.
What does Quality of Life tell us?
Quality of Life blends cost of living, nearby amenities, socioeconomic signals, and neighborhood character. City-level scores represent the whole municipality; individual neighborhoods can differ.
What does this tell us?
Quality of Life blends cost of living, nearby amenities, socioeconomic signals, and neighborhood character. City-level scores represent the whole municipality; individual neighborhoods can differ.
Cost of Living
16% above national average
The Real Cost of Living in Ellensburg, WA for 2026
| Tier | Individual | Family (4) |
|---|---|---|
| Survival | $20k | $38k |
| Comfortable | $64k | $94k |
| Luxury | $90k+ | $140k+ |
| Elite (Top 5%) | $110k+ | $170k+ |
53%
The Area Signal
A metric tracking the socioeconomic signals of the area.
Hobbies
Explore the areaGroceries
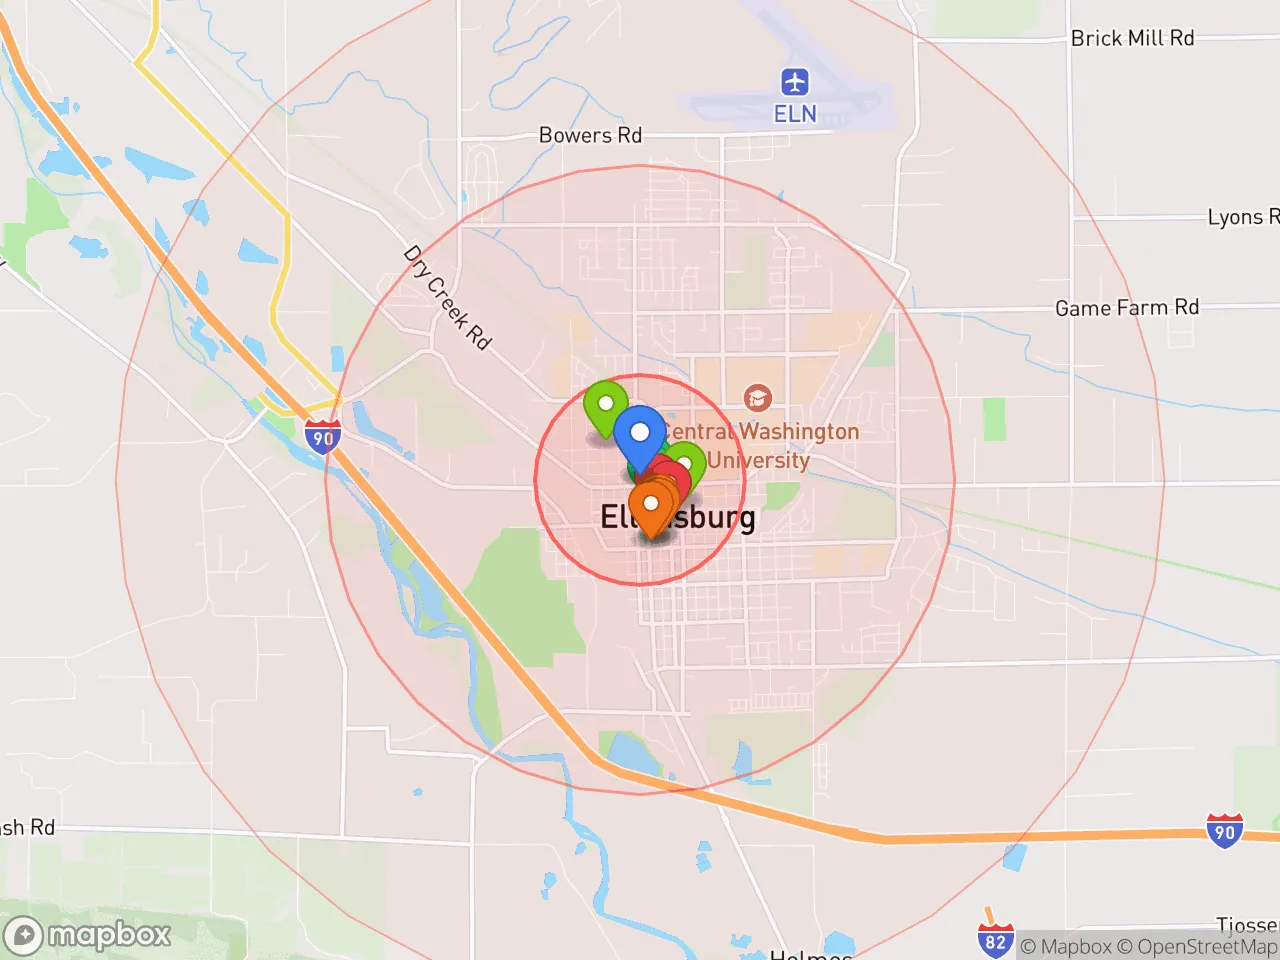
3 within 10 miles
Gas
20 within 10 miles
Hospital
1 within 20 miles
Airport
SEA — Seattle–Tacoma International
Post Office
USPS — Ellensburg, WA
Critical Amenities
Quality-of-Life Analysis
Ellensburg, Washington, presents a quality of life shaped by its role as a college town and a regional agricultural hub, with a cost of living index of 116 (16% above the U.S. average) that reflects its desirability and proximity to the rapidly growing Puget Sound region. The population skews younger and more educated than the state average, driven by Central Washington University (CWU) and a steady influx of professionals seeking a slower pace without sacrificing access to outdoor recreation. Median household income hovers around $52,000, notably lower than the state median of $85,000, creating a distinct economic profile where many residents trade higher earning potential for a lifestyle anchored in community and nature.
Cost of living, housing affordability, and how Ellensburg compares to nearby towns
Ellensburg’s housing market is the primary driver of its above-average cost of living, with a median home value of $357,800 and median rent of $1,258. While these figures are significantly lower than Seattle’s median home value of over $800,000, they are roughly 15-20% higher than in neighboring Yakima (median home value ~$290,000) and comparable to Wenatchee. The average commute of just 17.4 minutes is a standout advantage—far shorter than the 30+ minute averages in the Seattle suburbs—allowing residents to reclaim time otherwise lost to traffic. However, for renters and first-time buyers, the market is tight: vacancy rates hover around 2-3%, and prices have risen roughly 8% annually since 2020, outpacing local wage growth. This dynamic makes Ellensburg more affordable than the I-5 corridor but increasingly challenging for those on service-industry or agricultural wages.
What daily life is like: amenities, schools, and the local rhythm
Daily life in Ellensburg revolves around a compact, walkable downtown centered on historic buildings, local coffee shops like D&M Coffee, and seasonal events such as the Ellensburg Rodeo (one of the top 10 in the nation). The Ellensburg School District serves roughly 3,200 students and consistently scores above state averages in math and English proficiency, with Morgan Middle School and Ellensburg High School earning strong ratings. CWU provides a steady stream of cultural programming—theater, concerts, and guest lectures—that punches above the town’s population of 19,000. Outdoor amenities are a major draw: the Yakima River runs through town for fishing and rafting, and the nearby Manastash Ridge offers hiking and mountain biking within a 10-minute drive. The rhythm is distinctly seasonal—quiet and study-focused during the academic year, busier with tourists and students during summer rodeo and festival season.
Ellensburg is best suited for those who prioritize a tight-knit community, short commutes, and immediate access to nature over high salaries or urban nightlife. It works well for CWU faculty and staff, remote workers who can leverage the low commute time and relatively affordable housing, and families seeking strong public schools in a safe environment (violent crime rates are roughly half the national average). Retirees and outdoor enthusiasts also find the pace appealing, though the limited job market outside education, healthcare (Kittitas Valley Healthcare is a top employer), and agriculture means career changers may need to commute to Yakima or Cle Elum. For anyone who values a four-season climate, a downtown where you know your neighbors, and a cost structure that still feels reasonable compared to the West Side, Ellensburg offers a tangible quality-of-life trade-off that many find worthwhile.

Crime in Ellensburg, WA
Generally safer than 60% of comparable U.S. locations.
Violent CrimeViolent Crime Analysis
Property CrimeProperty Crime Analysis
Crime Analysis
Ellensburg, Washington, reports a violent crime rate of 230 incidents per 100,000 residents and a property crime rate of 1,552.2 per 100,000. These figures place the city in a complex safety position: violent crime is slightly above the national average, while property crime significantly exceeds both state and national benchmarks. The overall safety picture is mixed, with property offenses—particularly theft and vehicle break-ins—being the primary concern for most residents and visitors.
Crime in context
Compared to Washington state's 2024 violent crime average of roughly 280 per 100,000, Ellensburg's 230 rate is notably lower. However, the city's property crime rate of 1,552.2 per 100,000 is nearly 40% higher than the national average of approximately 1,100 per 100,000 and well above the state average of about 1,300. This disparity is driven largely by larceny-theft and motor vehicle theft, which are common in college towns and along the Interstate 90 corridor. The presence of Central Washington University contributes to a transient population and a higher density of unattended vehicles and bicycles, which are frequent targets. Readers should note that Kittitas County, which includes Ellensburg, has a justice system that has been influenced by progressive prosecutorial policies in recent years, including diversion programs and reduced sentencing for property crimes. Critics argue these approaches, while intended to reduce recidivism, can result in more repeat offenders on the street and a diminished deterrent effect, directly impacting public safety and victim restitution.
What residents experience
Daily life in Ellensburg involves a heightened awareness of property security. Residents commonly report package theft from porches, unlocked vehicle prowls, and occasional garage break-ins. Violent crime is less frequent but not absent; aggravated assaults account for the majority of incidents, often linked to domestic disputes or alcohol-fueled conflicts near downtown bars. The Ellensburg Police Department maintains a visible presence, particularly during the annual Ellensburg Rodeo and university events, but staffing levels are stretched. Response times for non-emergency property crimes can exceed 30 minutes, and clearance rates for theft are low—under 15% in recent years. This reality frustrates victims and reinforces the perception that property crime carries minimal consequences under current local policies.
Neighborhood-level variation is notable. Areas immediately surrounding the CWU campus and the downtown core experience the highest property crime density, while residential neighborhoods like North Ellensburg and the Reecer Creek area report lower incident rates. The city's west side, near the hospital and newer subdivisions, tends to have fewer reported crimes overall. Prospective residents should check block-level crime maps and consider that homes near major thoroughfares or rental-heavy zones face elevated risk. Overall, Ellensburg offers a relatively safe environment for violent crime but demands proactive property protection measures, especially given the local justice system's lenient approach to repeat property offenders.
* Values derived from national, state, county, city and local statistics and may differ in a specific area. Last updated: 2026-08-15T00:45:23.000Z
Narrative content on this page is AI-generated and may contain mistakes. Verify any details that matter before acting on them.
ReloMaps may earn a commission from affiliate links at no extra cost to you.

