Cost of Living by State Comparison: A Practical Guide

California's 2024 Regional Price Parity was 110.7, while Arkansas's was 86.9, meaning the same standardized basket cost about 10.7% more in California and 13.1% less in Arkansas than the U.S. average. That gap identifies a price difference, not the state where your household will necessarily have more money left after housing, taxes, insurance, childcare, healthcare, and commuting.
A useful cost of living by state comparison starts with the broad index, then tests the result against your income, spending pattern, and actual destination. State averages can narrow the search, but the final decision belongs at the metro, city, and neighborhood level.
Table of Contents
- What State Cost of Living Numbers Actually Mean
- The Methodology Behind Reliable State Comparisons
- Reading a State Cost of Living Comparison Table
- Why the Cheapest State Often Is Not the Most Affordable
- Matching Spending Baskets to Real Household Types
- How to Compare States Using ReloMaps
- Building a State and City Shortlist That Holds Up
- Frequently Asked Questions
What State Cost of Living Numbers Actually Mean
The headline comparison is clear. In the 2024 BEA Regional Price Parity data, California had the highest all-items RPP among states at 110.7, followed by Hawaii at 110.0 and New Jersey at 108.8. Arkansas had the lowest at 86.9, followed by Mississippi at 87.0, while Iowa and Oklahoma both recorded 87.8. The U.S. average is fixed at 100 in the BEA benchmark (BEA Regional Price Parities).
An RPP is a relative price-level measure. It asks how expensive a broad basket is in one place compared with the national average. An RPP of 110.7 means that the basket costs roughly 10.7% more than the benchmark. An RPP of 86.9 means it costs roughly 13.1% less. It doesn't tell you what a particular family earns, whether it rents or owns, or how far it drives to work.
Treat the index as a starting point
The practical mistake is to read the ranking as a household budget. A lower index can coexist with lower earnings, longer commutes, higher vehicle dependence, limited healthcare access, or insurance costs that a state average doesn't expose.
Use the index to normalize your first comparison, then keep the major categories visible:
- Housing: Rent, mortgage payments, property taxes, and insurance can dominate the budget.
- Transportation: A cheaper town may require more driving, vehicle ownership, fuel, maintenance, and insurance.
- Taxes and utilities: These determine what remains after the listed price is paid.
- Groceries and healthcare: Regional averages may differ from your household's actual consumption.
- Income: A price advantage matters only in relation to wages, salary, retirement income, or business revenue.
Build a basket before choosing a state
Start with your current monthly spending. Separate essentials from discretionary purchases, identify the costs that will change after a move, and choose a consistent income basis, preferably gross and after-tax views side by side. Then compare the same basket across candidate locations.
That process prevents a common analytical error. The question isn't, “Which state is cheapest?” It's, “Where can this household maintain its required lifestyle while retaining enough income for savings, risk, and flexibility?” The state ranking helps answer the first question. It can't answer the second without household context.
The Methodology Behind Reliable State Comparisons
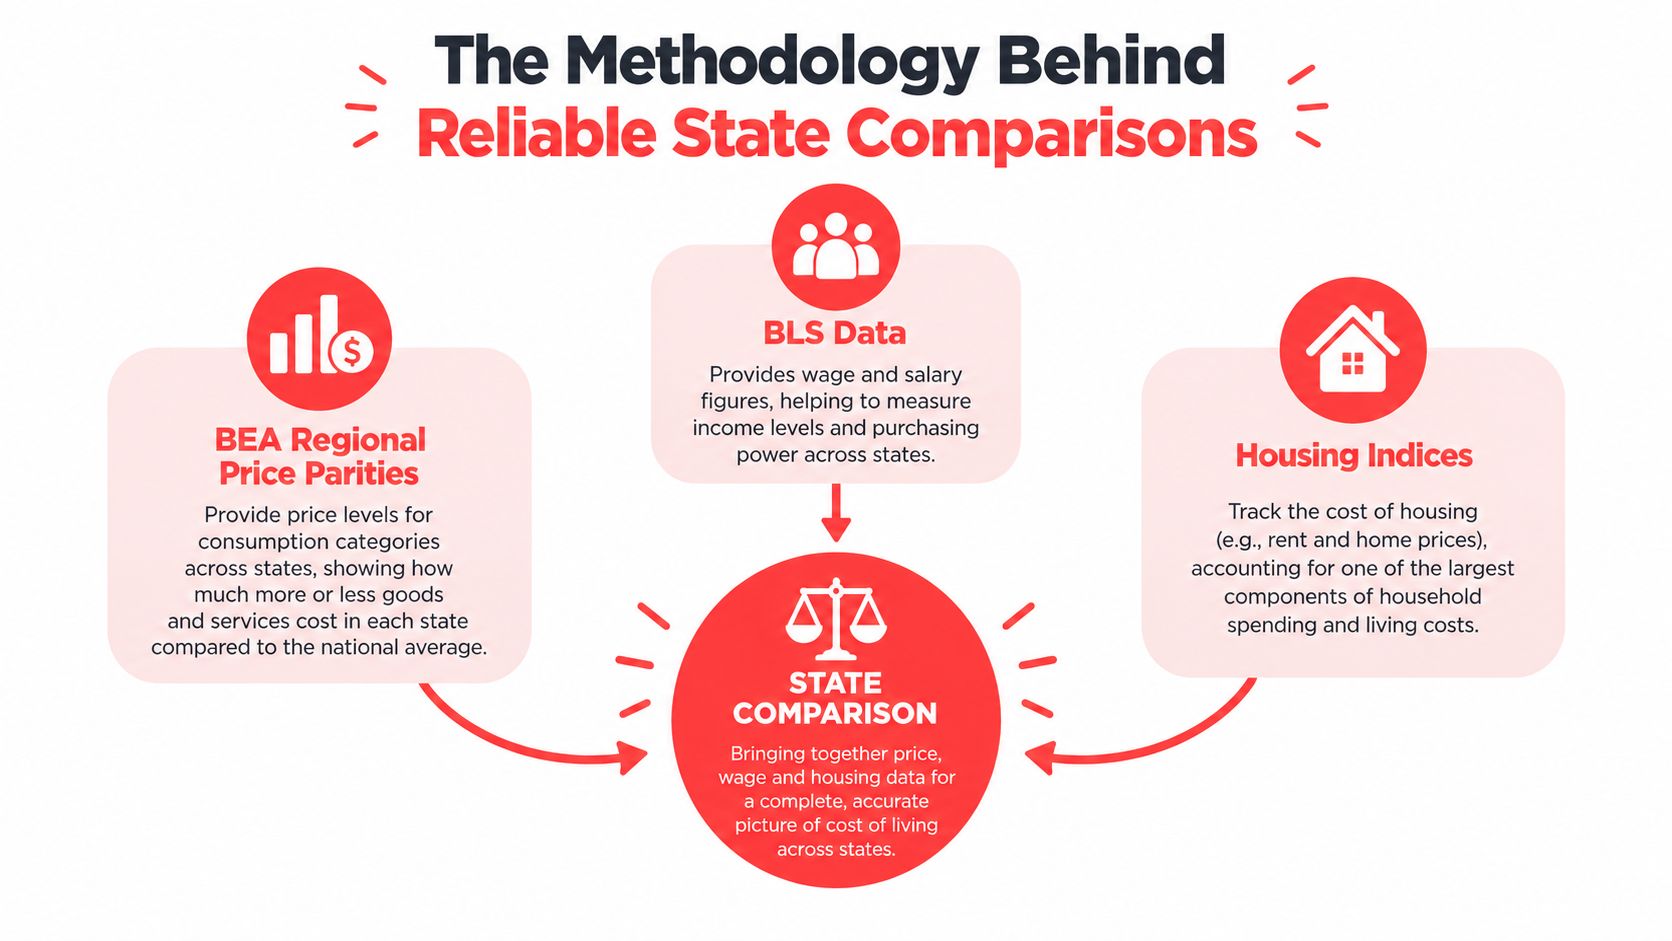
A defensible comparison layers three types of evidence rather than relying on one score. BEA RPP data measures relative prices across consumption categories. BLS Consumer Expenditure data shows how households allocate spending. Census housing and income data helps test whether the housing bill is manageable relative to earnings.
Match each dataset to the question
The BEA is the strongest state-level starting point because its RPP puts the national average at 100 and covers goods and services rather than housing alone. It answers, “How do overall price levels differ?” It doesn't answer, “Can I afford this location?”
The BLS answers a different question: “Which categories consume household spending?” That matters because a modest difference in a category that represents a large share of spending can matter more than a bigger difference in a category your household barely uses.
Census housing and income measures add affordability context. They connect the monthly housing bill to household earnings, although they still won't capture every household's taxes, insurance, debts, family structure, or commuting pattern.
Keep housing separate
Housing deserves its own line because it can dominate the overall result. In the BEA's 2023 housing-rents RPP, California reached 157.8, while Mississippi recorded 54.9, a 102.9-point gap (BEA state income and consumption release).
That gap explains why a broad state score can hide the pressure facing renters and buyers in specific markets. A household with a paid-off home may experience the same state very differently from a renter entering an expensive metro.
Practical rule: Compare the all-items index first, but never let it replace a housing, income, and transportation calculation.
For decisions involving a home sale, timing and proceeds can also affect the relocation budget. If you're evaluating whether to sell before moving, you can compare your quick sale choices separately from the geographic affordability analysis. ReloMaps' about page provides additional context on the platform's location-intelligence approach.
Reading a State Cost of Living Comparison Table
The table below combines the broad RPP signal with housing spending and monthly housing costs. It isn't a complete affordability ranking. It is a template for seeing why price levels, household behavior, and income need to appear together.
| State | All-Items RPP (2024) | Housing Share of Spending | Median Monthly Housing Cost |
|---|---|---|---|
| California | 110.7 | 37% | $2,055 |
| West Virginia | Not provided in the 2024 RPP comparison | Not provided in the cited BLS comparison | $710 |
The California housing figure was the highest among states in the cited 2023 Census comparison, and California was the only state above $2,000 in median monthly housing costs. West Virginia's figure was about $710, creating a $1,345 monthly gap, or roughly $16,140 annually, before taxes, transportation, utilities, insurance, and other expenses (housing-cost comparison using Census data).
Read the rows as a budget story
California's housing share was 37% of consumer spending, compared with 33% for the average U.S. consumer unit. That difference indicates a heavier housing allocation, but it doesn't prove that every California household faces the same burden. Renters, owners, families, and high-income households will have different outcomes.
The cited comparison reported median monthly household income of about $7,960 in California and $4,662 in West Virginia. Housing therefore represented an estimated 25.82% of California's median monthly household income and about 15.23% of West Virginia's. West Virginia's lower housing bill comes with a lower income base, so the gap can't be interpreted as pure disposable-income savings.
Replicate the logic locally
For each shortlisted city, record the same four questions:
- How does the broader price level compare?
- What share of household spending goes to housing?
- What is the monthly housing obligation?
- What income remains after essential costs?
The table becomes more useful when you add transportation, insurance, utilities, healthcare, and taxes for your own household. A city-level comparison can then reveal whether the state's apparent advantage survives contact with the actual neighborhood and commute.
Why the Cheapest State Often Is Not the Most Affordable
A low price index doesn't guarantee a high remainder at the end of the month. A 2025 household-affordability analysis estimated average shelter and utilities at $1,624 per month, or 18.5% of gross household income. It also estimated federal and state income taxes at $1,249 per month, or 14.2%, leaving an average of $2,170 per month, or 24.7% of gross income, after core necessities (household affordability analysis).
Those figures aren't a universal budget for every household. They demonstrate why a ranking based mainly on advertised rent or home price can mislead. Taxes, insurance, childcare, healthcare, fuel, and required services can absorb the apparent savings.
Affordability changes after the move
A household should calculate at least two outputs:
- Monthly required outflow: Housing, utilities, taxes, insurance, transportation, groceries, healthcare, childcare, and debt payments.
- Monthly retained income: Gross or net income minus those unavoidable costs, with the chosen income definition kept consistent.
The second number is the decision metric. A place with a lower rent can still lose if the household must buy another vehicle, drive farther, pay more for insurance, or accept a lower salary.
The pressure also changes over time. Wyoming's 2025 statewide inflation was 4.2%, with housing rising 5.8% and medical costs 3.8% in the cited analysis. Those figures show how affordability can deteriorate even in a state that appears inexpensive in a static comparison.
A cheap entry price isn't the same as a durable monthly surplus.
The right conclusion isn't that low-cost states are poor choices. It's that “cheapest” is an incomplete target. Choose the location where your household retains enough money after unavoidable costs and still has room for changes in insurance, health, work, family size, and housing.
Matching Spending Baskets to Real Household Types
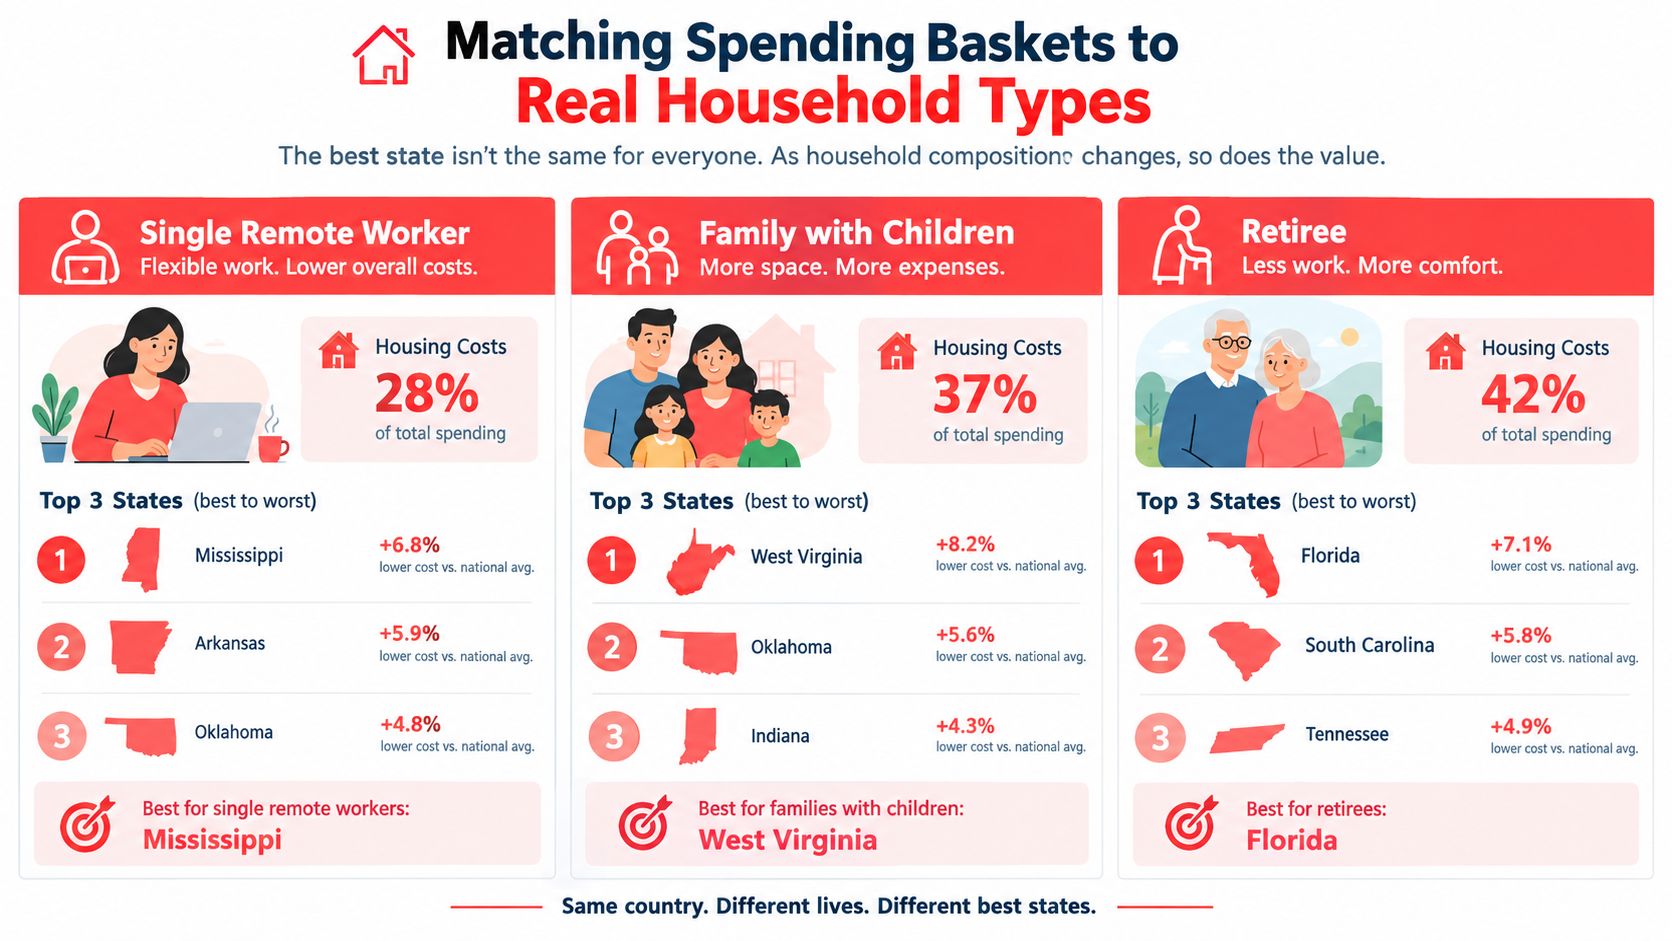
The same state ranking can produce different answers for different households because each household buys a different basket. A remote worker may prioritize housing and internet access. A family may care more about housing space, childcare, healthcare, and school access. A retiree may place greater weight on medical access, property taxes, insurance, and proximity to services.
The remote worker
A single remote worker may tolerate a smaller housing footprint and trade expensive urban access for lower housing costs. But “remote” doesn't automatically mean zero transportation spending. The Census Bureau reported that 13.3% of U.S. workers worked from home in 2024, down from 13.8% in 2023, and its definition excludes a hybrid worker who travels to an office on required days (Census commuting and work-from-home data).
That worker should price fuel, parking, tolls, vehicle wear, and unpaid travel time for the actual office schedule. A location with lower rent may become less attractive if every office visit requires a long drive.
The family with children
Families often need more space, which makes the housing share especially important. BLS data found that California households devoted 37% of spending to housing, while Texas households matched the national 33% housing share but spent 20% on transportation (BLS Consumer Expenditure comparison).
That contrast changes the calculation. A Texas household may see a manageable housing share but face a larger transportation budget because of distance, vehicle ownership, and daily logistics. Add childcare, insurance, healthcare, and school-related travel before calling a state affordable.
The retiree
A retiree should model recurring medical costs, insurance, property taxes, utilities, home maintenance, and access to care rather than focusing only on rent or purchase price. Fixed or less flexible income makes recurring volatility more important than a one-time bargain.
For all three households, create a checklist before trusting an index:
- Income: Use expected salary, business income, or retirement income.
- Housing: Model the actual tenure, property type, and insurance.
- Mobility: Count every required trip, not only the commute.
- Family needs: Include childcare, healthcare, education, and services.
- Risk: Test whether hazards or infrastructure could add future costs.
How to Compare States Using ReloMaps
Start with the national or state shortlist, then move immediately to the place where you'd live. Open the ReloMaps Grid and Map, filter by cost-of-living and household-income grades, and sort candidates by the overall ReloScore. The purpose isn't to outsource the decision. It's to keep the categories visible while reducing a large search area.
ReloMaps assigns each place an A+ to F ReloScore and transparent sub-scores across affluence, cost of living, crime and safety, population, quality of life, and strategic location. That framework lets a reader compare a Texas suburb with a New Hampshire town using consistent grades (ReloMaps).
Inspect the city, not just the state
Open a candidate city page, such as Austin, Texas on ReloMaps, and review the categories that affect your household. Check housing and affluence together, then examine commute, safety, population, quality of life, and strategic location. A favorable cost grade shouldn't cancel out a commute or risk grade that violates your household's limits.
The platform's Explore page can help narrow places by common priorities, including affordable, family-friendly, high-income, off-grid, conservative, and progressive. If your move depends on retaining location flexibility, you can also search remote jobs abroad while testing whether a fully remote arrangement changes your commute assumptions.
Add listing-specific context
A state or city score still isn't enough for a specific purchase. Paste a Zillow or Redfin listing URL into the property-context lookup to retrieve neighborhood and city information relevant to that home. This step helps expose local context that a listing's price alone doesn't show.
Give extra weight to housing burden, commute time, and FEMA risk when you compare finalists. Amenities matter, but they rarely compensate for a recurring cost or risk that your household can't absorb.

Building a State and City Shortlist That Holds Up
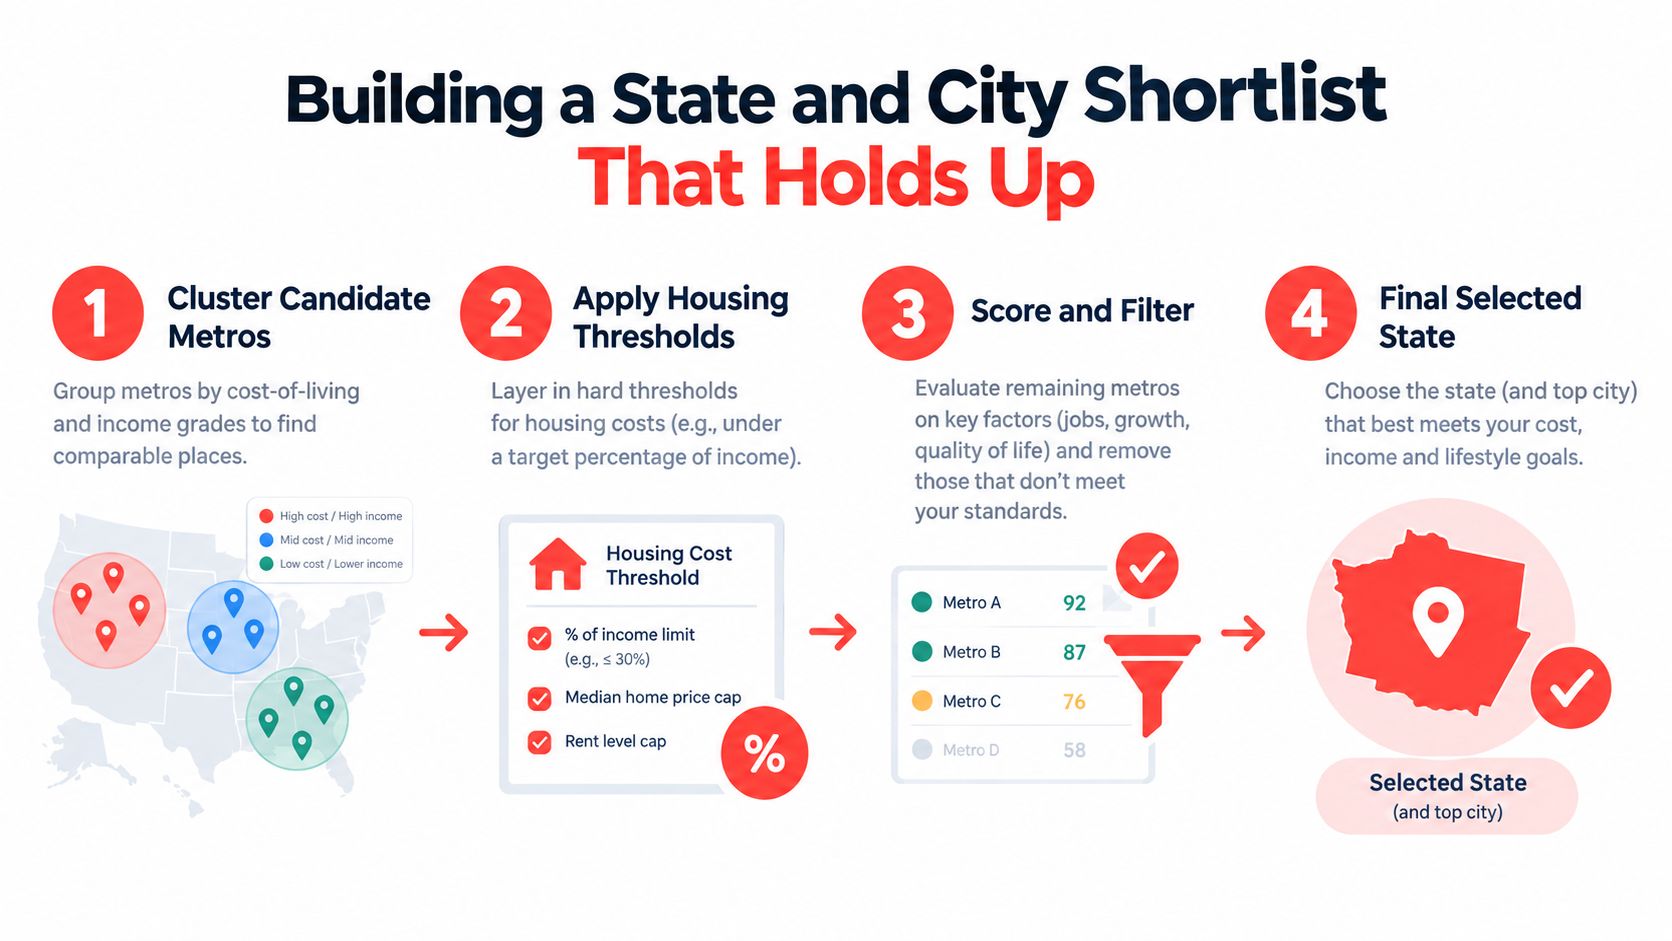
A reliable shortlist is a constraint system, not a popularity list. Begin by grouping candidate metros according to cost-of-living and income grades, then eliminate any place that fails a fundamental household requirement.
Use this four-step process:
- Cluster the candidates. Group metros with similar price and income characteristics instead of treating an entire state as uniform.
- Set hard limits. Define your maximum housing share, acceptable commute, and personal FEMA risk cutoff before you become attached to a location.
- Test the budget. Add taxes, insurance, utilities, transportation, healthcare, childcare, and maintenance to the same worksheet.
- Compare finalists. Narrow the field to two or three cities, then inspect neighborhood and property context.
Your thresholds should belong to the household, not to a generic ranking. One buyer may reject any location where the projected housing burden exceeds a chosen share of gross income. Another may accept a higher housing bill to avoid car dependence. A retiree may set a stricter healthcare-access requirement than a remote worker.
Keep one comparison sheet
For each finalist, record:
- Income and affordability: Expected income, housing burden, taxes, and retained monthly cash.
- Mobility: Office days, commute time, vehicle costs, parking, tolls, and access to essential services.
- Household fit: Family needs, healthcare access, homeownership, and local demographics.
- Risk and resilience: FEMA risk, disaster exposure, insurance implications, and proximity to major services.
- Change sensitivity: What happens if income, family size, or work arrangement changes?
You can use ReloMaps' cheapest-cities exploration as one input, but don't treat a low-cost label as the final answer. A state number is an input. The output is a city and neighborhood that still works after the complete household budget is applied.
Frequently Asked Questions
What affordability threshold should make me reconsider a state?
Reconsider a state when shelter, utilities, and taxes leave too little room for your household's required savings and variable costs. The cited affordability analysis provides a useful warning range, with shelter and utilities at 18.5% of gross income and modeled federal and state taxes at 14.2%. Treat those figures as screening markers, then add insurance, childcare, healthcare, transportation, and debt before setting your personal limit.
Does remote work eliminate relocation commute costs?
Remote work eliminates commute costs only when the job requires no office travel. The Census reported 13.3% of U.S. workers worked from home in 2024, and hybrid employees still travel on required office days. Price the actual schedule, including parking, tolls, fuel, vehicle wear, and unpaid travel time.
Can a state index beat city-level data for a relocation?
No, city-level data is more useful for a relocation decision than a state average. BEA RPP data is available for metropolitan areas as well as states, and local housing, transportation, and services can vary materially within one state. Use the state index to screen, then test the metro, city, and neighborhood.
Which hidden moving costs should I add to the budget?
Add temporary housing overlap, lease-break fees, state-specific vehicle inspections, and moving-insurance deductibles before comparing offers. These costs can occur during the transition even when the long-term monthly budget looks favorable, so keep a separate relocation reserve rather than hiding them inside rent or mortgage estimates.
Use ReloMaps to turn a broad state shortlist into a city and neighborhood comparison built around cost, income, safety, commute, quality of life, and strategic risk. Visit ReloMaps to compare locations, inspect local grades, and test the places that fit your household budget.
Enjoying the blog? Subscribe to ReloMaps+ for premium area intelligence — and to keep us independent.
Subscribe todayMore from the blog

Best States with No Income Tax: 9 Key Trade-Offs
Nine states are commonly covered in no-income-tax comparisons: Alaska, Florida, Nevada, New Hampshire, South Dakota, Tennessee, Texas, Washington, and Wyoming. The best choice depends on your total taxes, housing, insurance, utilities, employment access, climate exposure, and lifestyle, because no-income-tax status doesn't guarantee lower living costs. That distinction matters more than the headline. A state can remove tax from wages while shifting the bill toward property taxes, sales tax
![What State Has the Lowest Cost of Living? [2026 Data]](https://cdnimg.co/57ef7042-ba90-49a0-b00b-3c86d8c2ecbf/7a2d6a1e-d61a-4500-8240-858d707f31e3/what-state-has-the-lowest-cost-of-living-cost-analysis.jpg)
What State Has the Lowest Cost of Living? [2026 Data]
If you're asking what state has the lowest cost of living, the short answer is Mississippi or Oklahoma, depending on the index. Mississippi is the most common answer in broad annual affordability rankings, while Oklahoma takes the top spot in at least one 2026 cost-of-living index, which is exactly why headline rankings can mislead movers who don't check the methodology. People usually want one winner. In practice, families comparing a move don't choose from a spreadsheet headline. They ch

Cedar Park Washington Guide to Cost Commute and Living
Cedar Park, Washington is the Cedar Park neighborhood in northeast Seattle, not an incorporated city. It sits on the west shore of Lake Washington, was annexed into Seattle in 1954, and functions more like a lakeside commuter suburb than a dense urban core, with typical drive times of about 20 to 30 minutes to Downtown Seattle under normal conditions. That access depends heavily on SR-522, so peak congestion matters. Table of Contents * What Cedar Park Washington Actually Refers To