What State Has the Lowest Cost of Living? [2026 Data]
![What State Has the Lowest Cost of Living? [2026 Data]](https://cdnimg.co/57ef7042-ba90-49a0-b00b-3c86d8c2ecbf/7a2d6a1e-d61a-4500-8240-858d707f31e3/what-state-has-the-lowest-cost-of-living-cost-analysis.jpg)
If you're asking what state has the lowest cost of living, the short answer is Mississippi or Oklahoma, depending on the index. Mississippi is the most common answer in broad annual affordability rankings, while Oklahoma takes the top spot in at least one 2026 cost-of-living index, which is exactly why headline rankings can mislead movers who don't check the methodology.
People usually want one winner. In practice, families comparing a move don't choose from a spreadsheet headline. They choose between trade-offs like lower housing costs, local wages, commute realities, storm exposure, taxes, and whether a cheap state still works for daily life.
Table of Contents
- Finding the Cheapest State to Live In
- How Cost of Living Indices Are Calculated
- Lowest Cost States in 2026 Ranked by Index
- Why Lower Cost Does Not Always Mean More Affordable
- Using ReloMaps to Compare States Yourself
- How to Choose the Right Low-Cost State for You
- Frequently Asked Questions
- How close do two cost-of-living scores need to be before I should treat them as basically tied?
- Can a low-cost state still feel expensive after I move?
- How should remote workers compare cheap states differently from local job seekers?
- What's the fastest way to compare state affordability without getting fooled by averages?
- When does housing matter more than the overall state index?
Finding the Cheapest State to Live In
Which state is cheapest to live in if one ranking says Mississippi and another says Oklahoma?
For relocation planning, that question matters less than many headline-driven articles suggest. Families are not moving to an index score. They are comparing rent or home prices, insurance, taxes, commute patterns, job options, and whether a lower monthly budget still supports the life they want.

The states that keep surfacing in low-cost comparisons are familiar: Mississippi, Oklahoma, Arkansas, and West Virginia. The order shifts because the methodology shifts. One widely cited annual ranking places Mississippi first with a composite index of 83.3, about 16.7% below the national average of 100, and lists a median home value of $162,100 and median income of $46,511, which points to the trade-off many movers miss. Lower housing costs often sit alongside lower local earnings (World Population Review's least expensive states ranking).
A separate 2026 first-quarter index puts Oklahoma first at 83.5 and Mississippi second at 86.2. That does not create a contradiction. It shows how a different time window and a different composite formula can flip the top spot.
That distinction is practical, not academic.
If a family is choosing between Tulsa, Jackson, Little Rock, and Charleston, the better takeaway is:
- Mississippi appears consistently near the bottom of broad annual cost rankings.
- Oklahoma can come out cheapest in quarterly index snapshots.
- Arkansas and West Virginia remain part of the same low-cost tier in many comparisons.
- Housing costs usually do most of the work in pulling these states below the national average.
In real relocation work, I treat any "cheapest state" headline as a starting point, not a conclusion. A state can rank well on a composite index and still be a weak fit if wages are lower in your field, homeowners insurance runs high in the area you want, or the lowest-cost towns are far from the jobs and schools that matter to your household.
Bottom line: The cheapest state depends on the index you use. The useful comparison is not just who ranks first. It is which method matches the way your household actually spends money.
How Cost of Living Indices Are Calculated
Cost-of-living rankings look simple because they collapse many expenses into one score. The score itself is never simple. It blends categories like housing, groceries, utilities, transportation, healthcare, and other everyday costs against a national benchmark where 100 equals the U.S. average.
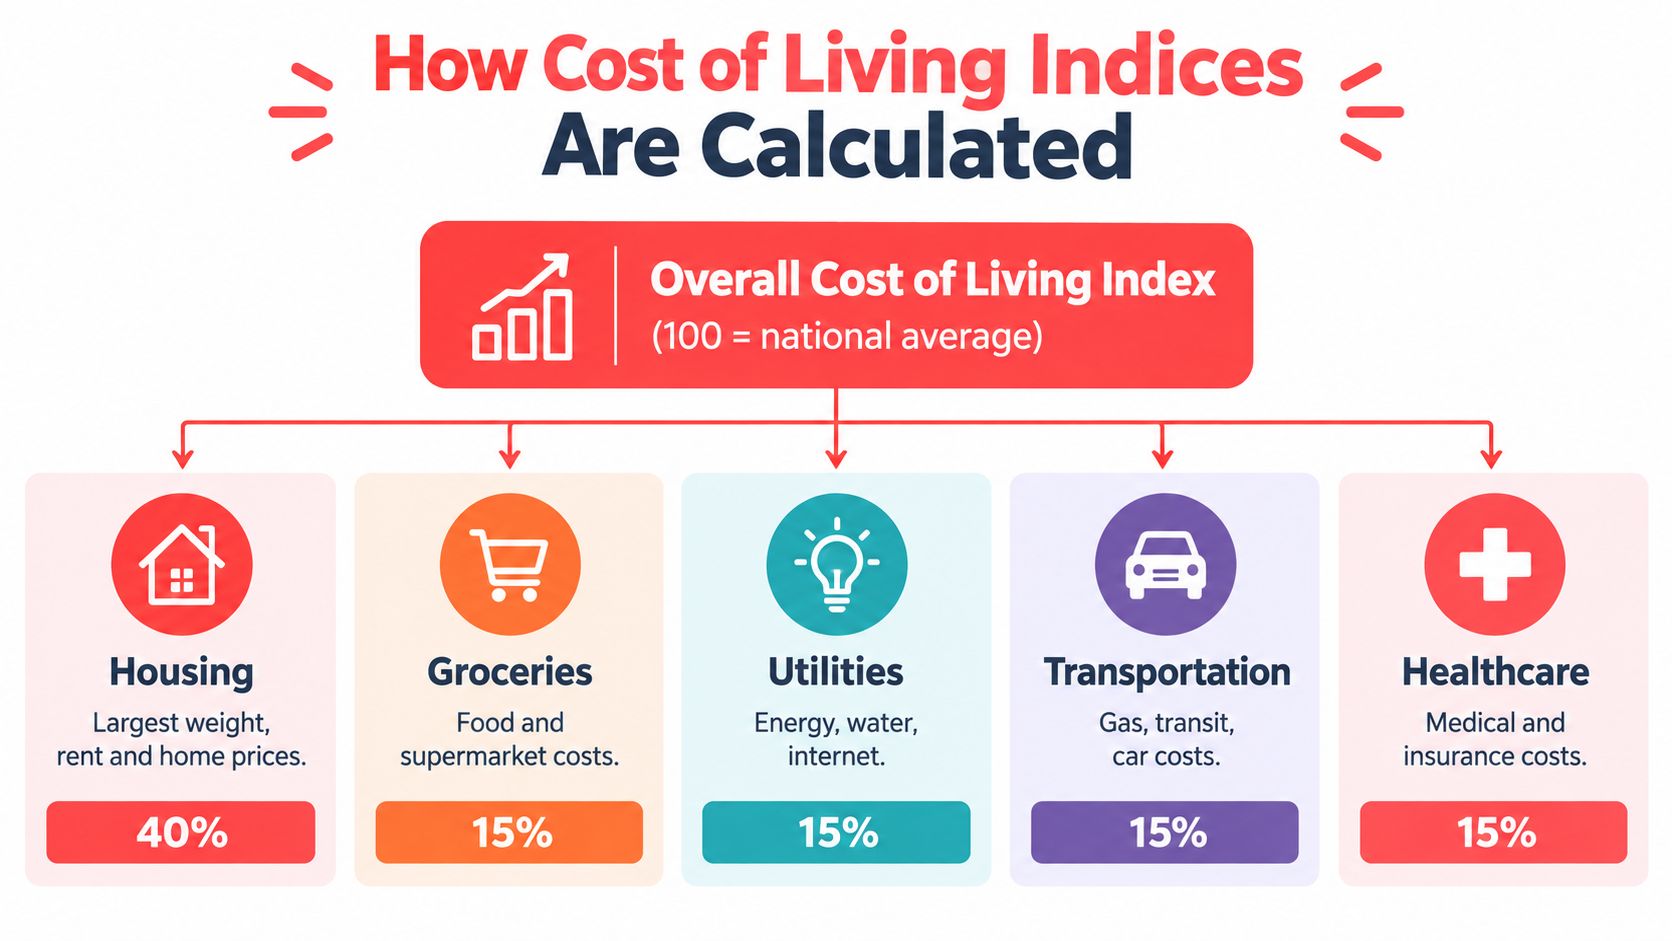
That sounds straightforward until you compare sources. One index may lean harder on housing. Another may update more frequently. Another may use a broader regional price framework instead of a consumer-oriented composite ranking. If you're evaluating relocation data, that's where confusion starts.
What the index is trying to measure
Most state rankings aim to answer one question: how expensive is a typical basket of living costs in one state compared with the country overall?
That basket usually includes:
- Housing costs such as home prices or rent, which often carry the biggest weight
- Groceries and daily goods that shape recurring weekly spending
- Utilities including household services and energy
- Transportation such as driving and commuting costs
- Healthcare and related out-of-pocket expense patterns
A broad overview of these comparison mechanics matters because readers often assume a rank is fixed when it isn't. The ReloMaps about page is useful context here because it shows a different approach to location decisions: compare multiple datasets at once instead of relying on one headline score.
Why two credible rankings can disagree
The cleanest example is the Mississippi versus Oklahoma split. One 2026 source says Mississippi is the least expensive overall. Another says Oklahoma is cheaper in Q1. Both can be valid because the underlying model can change in three ways.
| Reason rankings flip | What changes |
|---|---|
| Time period | Annual averages and quarterly snapshots can produce different leaders |
| Weighting | A housing-heavy index can reward a different state than a broader basket |
| Data model | Consumer-style composites and regional price parity frameworks aren't the same tool |
Practical rule: When a ranking difference is small, treat the top four states as a cluster, not as a dramatic gap.
There's also a second layer. The Bureau of Economic Analysis uses Regional Price Parities, which are designed to show how much a typical basket of goods and services costs relative to the national average. In one recent summary, Mississippi's overall RPP is 87.0, meaning prices are about 13% below the U.S. average, and the same discussion notes how lower shelter costs have an outsized effect on total living costs (ConsumerAffairs summary of BEA parity data).
That distinction matters. A state can look cheap in a broad parity measure because prices are compressed across categories, not just because home listings are inexpensive.
Lowest Cost States in 2026 Ranked by Index
Which state is cheapest in 2026 if one ranking says Mississippi and another puts Oklahoma on top? The practical answer is that the winner changes with the index, so the useful move is to compare the small group of states that keep showing up near the top.
2026 low-cost state rankings comparison
| State | Cost Index | Below National Avg | Primary Driver |
|---|---|---|---|
| Mississippi | 83.3 | 16.7% | Broad affordability with a low housing-price base |
| Oklahoma | 83.5 | 16.5% | Very low housing costs |
| Arkansas | 86.9 | 13.1% | Low housing costs |
| West Virginia | N/A in this source set | N/A in this source set | Very low housing-related costs in several comparisons |
The pattern matters more than the exact order. Mississippi, Oklahoma, Arkansas, and West Virginia keep surfacing in low-cost comparisons, but they do not get there for identical reasons. Mississippi tends to perform well in broader annual summaries. Oklahoma often rises to the top in index models where housing carries more force.
One 2026 comparison map puts Oklahoma at 83.5 against a national baseline of 100, which places overall living costs 16.5% below the national average (Yahoo Finance cost-of-living map). A separate consumer roundup places Arkansas at 86.9 and also ties its low score to housing costs, while noting that Oklahoma leads in another 2026 ranking (Yahoo Finance personal finance comparison).
MERIC's cost-of-living series sharpens that point by showing Oklahoma first with an overall index of 83.0 and a housing index of 65.1 (Missouri Economic Research and Information Center cost-of-living data). That is the kind of methodology shift that flips a headline ranking. If shelter is the biggest pressure point in your budget, Oklahoma can look like the clear leader. If you care more about a broader annual basket, Mississippi may still come out ahead.
I usually tell relocating families to treat these states as a shortlist, not a podium.
For a state-level starting point with local context, Mississippi cost-of-living details on ReloMaps are more useful than another generic top-10 list because they let you compare places inside the state instead of assuming the whole market works the same way.
What works when you compare these rankings
- Track repeat appearances. States that show up across multiple index types deserve more attention than a one-off winner.
- Check what drives the score. A low total index built mostly on cheap housing creates a different relocation case than one supported by lower costs across groceries, utilities, and transportation.
- Treat close scores as a practical tie. A few points on an index can disappear fast once you narrow the search to the metro, suburb, or rural county where you would live.
- Use the index as a screening tool. The ranking helps you build a candidate list. It does not settle the relocation decision by itself.
Why Lower Cost Does Not Always Mean More Affordable
What happens if the "cheapest" state cuts your housing payment but also cuts your paycheck, raises your insurance bill, or pushes you into a longer commute?

That is the mistake behind a lot of one-number rankings. They measure cost, not your actual budget after the move. A low index can come from cheaper housing, but your real monthly picture also depends on income, taxes, insurance, and how far you have to drive for work, school, and healthcare.
Mississippi is a good example. As noted earlier, it often lands at or near the top of least-expensive state rankings. That does not settle the affordability question for every household. A remote worker keeping a higher out-of-state salary may see immediate savings there. A household switching into the local job market may get a very different result.
I have seen this play out many times. Two families can choose the same low-cost state and have opposite outcomes because one keeps its income base and the other has to rebuild it locally.
Three trade-offs that change the decision
The state index is only the starting screen. These are the pressure points that usually change the answer.
- Income fit: Lower costs help more when income holds steady. If pay resets to local rates, the savings can shrink fast.
- Tax and fee structure: Sales taxes, property taxes, car registration, and insurance premiums can narrow the gap between two "cheap" states.
- Household geography: The lowest-cost area in a state may mean fewer employers, longer drives, and less convenient access to specialists, childcare, or daily services.
Methodology matters here too. Some rankings give more weight to housing. Others make a broader basket of goods and services do more of the work. That is why a state can look excellent on one list and less compelling once you factor in wages, taxes, and the part of the state where you would live. One 2026 affordability review makes this point directly by shifting attention from the headline winner to the states that stay affordable after you account for housing, taxes, and local wage levels (Costng's affordability discussion).
Costs that tend to appear after the move
These line items are easy to miss during the search and hard to ignore once the bills start arriving:
- Insurance changes tied to weather risk, rebuilding costs, and local carriers
- Commute costs when cheaper homes sit well outside major job centers
- Utility patterns that change with climate, housing stock, and heating or cooling needs
- Relocation expenses such as deposits, movers, storage, temporary housing, and setup fees
This video is a useful reset if you're still tempted to reduce the decision to one cheap-state headline.
People don't move into a statewide average. They move into a specific county, school zone, commute pattern, and insurance market.
That is why the lowest cost state on paper does not always produce the lowest real-life cost for your household.
Using ReloMaps to Compare States Yourself
Static rankings are fine for a first pass. They break down once your household priorities get specific. If you're deciding between low-cost states, you need a way to compare places with your own filters instead of accepting one publisher's weighting scheme.

One option is ReloMaps Explore, which lets you filter cities and towns by cost, crime and safety, demographics, commute patterns, home values, rents, and disaster-related context in one interface. That matters because low statewide cost doesn't tell you which metro or smaller city fits your work, family, or risk profile.
A repeatable way to compare low-cost states
When I'm helping families narrow choices, I push them toward a simple sequence.
- Start with the low-cost cluster, not one winner. If Mississippi, Oklahoma, Arkansas, and West Virginia all fit the budget headline, keep them all alive at first.
- Screen for deal-breakers. Commute tolerance, political fit, disaster exposure, taxes, and school preferences eliminate places faster than tiny index differences.
- Drop to the metro or city level. State averages hide a lot. A small city can feel far cheaper or far harder than the statewide number suggests.
- Compare at least one non-cheap benchmark. This gives you a control point and helps you see whether the savings are worth the trade-offs.
What to look at beyond the cost score
State rankings answer only one question. A move requires several.
- Work pattern: Hybrid and remote households should check commute times and work-from-home prevalence.
- Housing path: Renters and buyers can reach different conclusions in the same market.
- Safety and lifestyle: A low-cost county may not align with your day-to-day comfort level.
- Hazard context: Cheap housing near recurring weather risk can change long-term carrying costs.
For metro-level context, comparing a higher-cost example like Austin, Texas on ReloMaps against lower-cost markets helps people see what they're giving up or gaining. That contrast is often more useful than debating whether one low-cost state beat another by a few index points.
Compare places the way you spend money, not the way a national ranking summarizes money.
That mindset saves time and usually prevents the classic relocation mistake of choosing a cheap state that doesn't fit the household.
How to Choose the Right Low-Cost State for You
The right low-cost state depends less on who wins the ranking and more on how your income and lifestyle interact with that place. Mississippi may look strongest in one annual summary. Oklahoma may lead in another index. Arkansas and West Virginia may fit better once you zoom in on housing or local geography. None of that tells you where you should move without household context.
A practical decision filter
Use this short framework instead of chasing a single cheapest-state headline:
- If your income is portable, prioritize places where housing stays low across multiple local markets.
- If you're job-hunting locally, put wage fit and employer concentration ahead of rank order.
- If you're raising kids, don't let a statewide average override school-zone, safety, and commute realities.
- If you're retiring or downsizing, focus on the full monthly burn rate, not just purchase price.
- If climate or storm exposure matters, compare low-cost states by hazard trade-offs before you compare them by index.
A lot of bad moves happen when people optimize for one metric and assume the rest will sort itself out. It usually doesn't. The families who make better relocation decisions treat cost of living as a starting screen, then test whether daily life in that state fits the way they work, spend, and want to live.
The best answer to what state has the lowest cost of living is still useful. It's just not enough on its own.
Frequently Asked Questions
How close do two cost-of-living scores need to be before I should treat them as basically tied?
Ask a simpler question first. Are the states separated by meaningful monthly costs for your household?
If two states keep trading the top spot across different indices, I treat them as tied until the category details show a real gap. One index may give housing more weight. Another may spread weight more evenly across groceries, utilities, transportation, and healthcare. A tiny difference in the headline score usually matters less than whether your budget is rent-heavy, car-heavy, or income-constrained.
Can a low-cost state still feel expensive after I move?
Yes.
I see this with households that save on home price but give that savings back through commuting miles, higher insurance, weaker local wages, or limited access to healthcare and services. A state can look cheap on paper and still stretch the monthly budget if daily life requires more driving, more time, and more out-of-pocket spending than expected.
How should remote workers compare cheap states differently from local job seekers?
Remote workers can put more weight on housing, taxes, and total monthly spending because their pay may stay the same after the move. Local job seekers need to pressure-test the move against local compensation, not just statewide cost rankings.
That distinction changes the result more often than people expect. The state with the lowest index is not always the state where a local salary goes furthest.
What's the fastest way to compare state affordability without getting fooled by averages?
Use the state ranking as a shortlist, then compare actual places inside those states. State averages hide a lot. College towns, energy corridors, tourist areas, and fast-growing suburbs can price very differently from the rest of the state.
ReloMaps helps with that next step by letting you compare cities and towns using cost, safety, demographics, hazard context, and other relocation filters in one place. It is a practical way to test whether a low-cost state also fits how your household lives.
When does housing matter more than the overall state index?
Housing matters most when it takes the largest share of your budget, or when you are close to the line between renting and buying. In those cases, a state's low overall score may be doing most of its work through cheap shelter rather than broad affordability across every category.
That is why methodology matters. A "cheapest state" headline can flip once you compare a housing-heavy index with one that gives more weight to transportation, healthcare, or other recurring costs.
Enjoying the blog? Subscribe to ReloMaps+ for premium area intelligence — and to keep us independent.
Subscribe todayMore from the blog

Cedar Park Washington Guide to Cost Commute and Living
Cedar Park, Washington is the Cedar Park neighborhood in northeast Seattle, not an incorporated city. It sits on the west shore of Lake Washington, was annexed into Seattle in 1954, and functions more like a lakeside commuter suburb than a dense urban core, with typical drive times of about 20 to 30 minutes to Downtown Seattle under normal conditions. That access depends heavily on SR-522, so peak congestion matters. Table of Contents * What Cedar Park Washington Actually Refers To

How to Compare Cost of Living Between Cities the Right Way
A city with a lower headline index can still cost your household more. The reliable way to compare cost of living between cities is to normalize the same basket of goods and services against one base city, assign weights that reflect your spending, and keep housing, taxes, utilities, groceries, transportation, and healthcare visible as separate categories. That approach produces a defensible shortlist rather than a generic ranking. It also explains why two households with the same income c