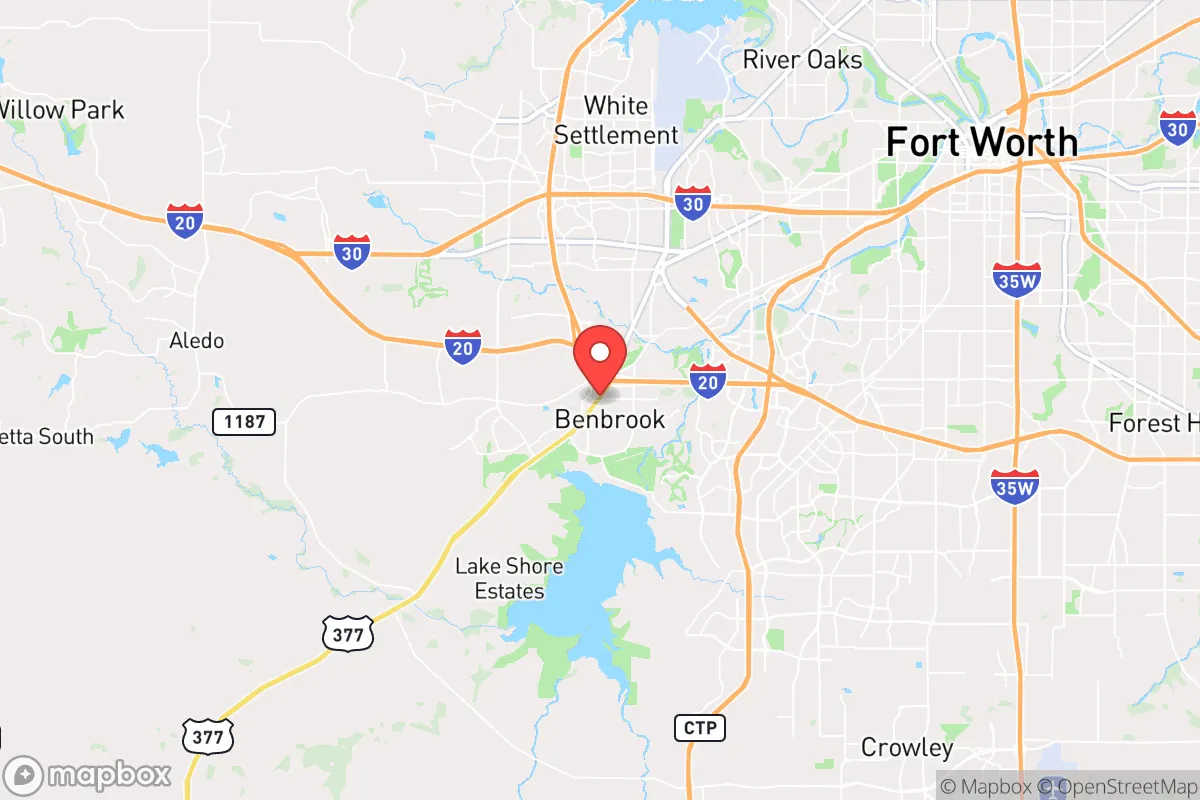
Demographics of Benbrook, TX
Affluence Level in Benbrook, TX
A middle-class area roughly in line with national averages across income, home values, education, and employment.
People of Benbrook, TX
The people of Benbrook, Texas today number 24,430, forming a predominantly white (65.8%) and Hispanic (24.1%) community with small Black (5.0%) and East/Southeast Asian (1.3%) populations. The city is notably more college-educated (44.4%) than the national average and has a very low foreign-born share (2.7%), reflecting a population shaped overwhelmingly by domestic in-migration rather than international immigration. Benbrook’s identity is that of a stable, family-oriented suburb where long-term homeowners and newer arrivals from within the Dallas-Fort Worth metroplex coexist in distinct, historically rooted neighborhoods.
How the city was settled and grew
Benbrook’s human history begins not with colonial settlement but with the arrival of the Texas and Pacific Railway in the late 19th century. The town was officially platted in 1885 as a stop along the rail line, drawing a small population of Anglo-American farmers and ranchers who took advantage of the area’s fertile Blackland Prairie soils. The original core of the community formed around what is now the Benbrook Historic District, a cluster of early-1900s homes and commercial buildings along Benbrook Boulevard. These early residents were overwhelmingly of Northern European descent—English, Scots-Irish, and German—who came for land grants and railroad work. The community remained tiny and rural through the 1930s, with fewer than 500 residents, until the construction of Benbrook Lake (completed 1952) by the U.S. Army Corps of Engineers. The lake project brought a wave of construction workers and engineers, many of whom settled in the Lakewood Estates neighborhood, which became the first planned subdivision in the city. By 1960, Benbrook’s population had grown to roughly 3,000, still almost entirely white and native-born.
Modern era (post-1965)
The post-1965 period transformed Benbrook from a sleepy lake town into a suburban bedroom community for Fort Worth. The 1965 Hart-Cellar Act had minimal direct effect here—Benbrook’s foreign-born population remains just 2.7% today—but the broader suburbanization of the Dallas-Fort Worth metroplex drove explosive growth. Between 1970 and 1990, the city’s population quadrupled from roughly 4,000 to over 16,000, fueled by white middle-class families leaving Fort Worth’s inner city for newer housing and better schools. The Ridglea Hills subdivision, developed in the 1970s, absorbed much of this wave, offering large lots and proximity to the lake. A second wave of domestic in-migration came in the 1990s and 2000s, as Hispanic families began moving into Benbrook from Fort Worth’s south side and from other parts of Texas. This Hispanic growth concentrated in the Westpark and Benbrook Lake Estates areas, where more affordable housing stock and multi-generational living arrangements were common. The Black population, now 5.0%, grew more slowly, with most Black residents settling in the Chisholm Trail neighborhood near the city’s eastern edge. The East/Southeast Asian community (1.3%) and Indian subcontinent community (0.4%) remain very small, with no single neighborhood concentration; these residents are typically professionals drawn to the city’s schools and commute to defense or tech jobs in Fort Worth.
The future
Benbrook’s demographic trajectory points toward slow, steady homogenization rather than rapid diversification. The city is nearly built out—available land for new subdivisions is scarce—so future population growth will come from infill development and generational turnover rather than large-scale in-migration. The Hispanic share (24.1%) is likely to continue rising gradually as younger Hispanic families age into homeownership and as older white residents pass away or move to retirement communities. However, the foreign-born share (2.7%) is so low that international immigration will not be a major driver. The white share (65.8%) will probably decline slowly but remain the majority for at least another generation. The Black and Asian shares are expected to remain stable or grow only marginally, as Benbrook lacks the employment base or housing diversity to attract large new populations from those groups. The city is not tribalizing into distinct ethnic enclaves—neighborhoods remain largely mixed by income and race—but the Westpark area will likely become increasingly Hispanic, while Ridglea Hills and Lakewood Estates will remain predominantly white and older.
For someone moving in now, Benbrook is becoming a mature, settled suburb where demographic change is slow and incremental. The population is overwhelmingly native-born, family-oriented, and college-educated, with a strong conservative tilt. New residents will find a community that values stability, low crime, and good schools, but one that offers little ethnic or cultural diversity. The city’s future is one of gradual graying and modest Hispanic growth, not transformation.
* Values derived from national, state, county, city and local statistics and may differ in a specific area. Last updated: 2026-04-27T02:21:47.000Z
Narrative content on this page is AI-generated and may contain mistakes. Verify any details that matter before acting on them.
ReloMaps may earn a commission from affiliate links at no extra cost to you.