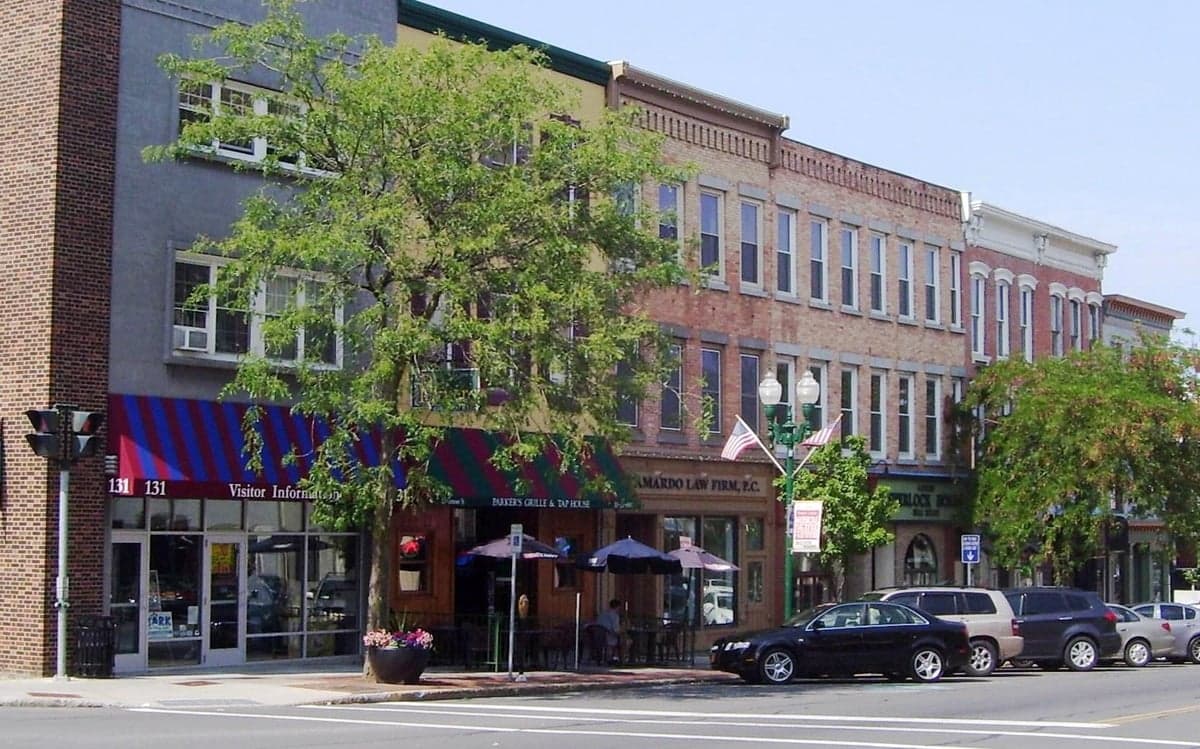
Photo: Wikipedia
Demographics of Auburn, NY
Affluence Level in Auburn, NY
A below-average socioeconomic profile. Incomes, home values, and educational attainment trail the U.S., with higher poverty and unemployment.
People of Auburn, NY
The people of Auburn, NY today form a predominantly white, working-to-middle-class community of roughly 26,500 residents, with a notably low foreign-born share of just 0.9% and a college attainment rate of 20.3%. The city’s identity is rooted in its industrial past and a slow, modest diversification: the Black population stands at 6.1%, the Hispanic share at 4.0%, and East/Southeast Asian and Indian communities each represent less than half a percent. Auburn remains a place where longtime local families, many of Irish, Italian, and Polish descent, live alongside smaller but established minority populations, giving it a stable, insular character compared to larger Upstate cities.
How the city was settled and grew
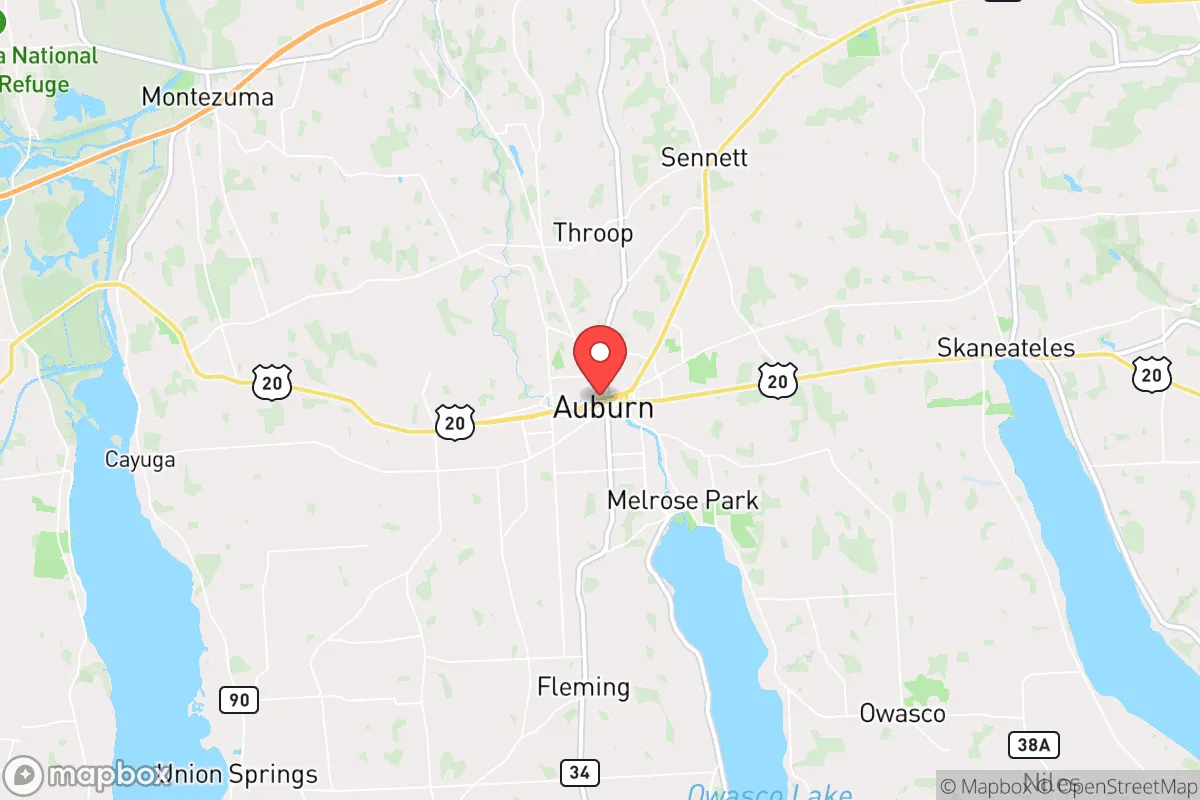
Auburn’s population history begins with the Cayuga people, who inhabited the region until the Sullivan-Clinton campaign of 1779 cleared the area for Euro-American settlement. The first permanent white settlers arrived in the 1790s, drawn by fertile land along the Owasco Lake outlet. The village was formally founded in 1805 and quickly became a manufacturing hub thanks to water power from the Owasco River. The opening of the Erie Canal in 1825 and later the New York Central Railroad turned Auburn into a major industrial center, attracting waves of immigrants. Irish laborers built the canal and railroads, settling in the near-downtown area now known as the Northside, where St. Mary’s Church became their anchor. Germans followed in the 1840s–1860s, clustering in the western part of the city around what is today the West End neighborhood, working in the shoe factories and foundries. Italians arrived in large numbers between 1890 and 1920, taking jobs in the Auburn Prison, the American Locomotive Company (ALCO), and the Dunn & McCarthy shoe factory; they concentrated in the Southside neighborhood, particularly along South Street and Franklin Street, where Italian social clubs and bakeries still mark the area. Polish immigrants, arriving around the same period, settled in the eastern part of the city near the former ALCO plant, in what is now the East End, establishing St. Hyacinth’s Church as their community center. By 1900, Auburn’s population had swelled to over 30,000, and it remained a classic industrial melting pot through the 1950s.
Modern era (post-1965)
After the 1965 Hart-Cellar Act, Auburn saw only a trickle of new foreign immigration, unlike larger Upstate cities. The foreign-born share has never risen above 2% in the modern era. Instead, the city’s demographic changes since the 1970s have been driven by domestic migration and suburbanization. White flight to surrounding towns like Sennett, Owasco, and Fleming began in the 1970s and accelerated through the 1990s, reducing Auburn’s white population from over 95% in 1970 to 81.5% today. The Black population, historically small and concentrated in the West End near the former New York Central rail yards and the Booker T. Washington Community Center, grew from about 3% in 1970 to 6.1% by 2020, largely through internal migration from other Upstate cities like Syracuse and Rochester. The Hispanic population, now 4.0%, began growing in the 1990s, with Puerto Rican and Dominican families settling in the Northside and parts of the Southside, often in older housing stock left by departing white families. The East/Southeast Asian population (0.4%) and Indian population (0.1%) remain negligible, mostly professionals associated with Auburn Community Hospital or the state prison system, and they are scattered rather than concentrated in any single neighborhood. The city’s overall population has declined from a peak of 36,722 in 1960 to 26,475 in 2020, reflecting deindustrialization and the loss of ALCO and other major employers.
The future
Auburn’s population trajectory points toward continued slow decline and modest diversification, but not rapid change. The city’s low foreign-born share (0.9%) means it is not a destination for new immigrants, and the Hispanic and Black populations are growing at a pace of roughly 0.2–0.3 percentage points per year. If current trends hold, Auburn will remain roughly 75–78% white by 2040, with a Hispanic share of 6–7% and a Black share of 8–9%. The East/Southeast Asian and Indian populations are likely to remain below 1% each, as the city lacks the tech or university sectors that attract these groups. Neighborhoods are not strongly tribalizing: the Northside and Southside are becoming more mixed as older white residents age out and younger minority families move in, while the West End remains the most diverse area. The East End and the newer subdivisions on the city’s fringe (such as the Melrose Road area) are the whitest and most stable. The city is not homogenizing into a single identity, but rather slowly blending its older ethnic enclaves into a more uniformly working-class, multi-ethnic community.
For someone moving to Auburn now, the city offers a stable, slow-changing population with a strong sense of local history and relatively low racial tension compared to larger Upstate cities. The trade-off is limited ethnic diversity and a demographic profile that skews older and less educated than the national average. New residents, particularly those from outside the region, should expect a community where longtime families dominate social and civic life, and where the pace of change is measured in decades, not years.
* Values derived from national, state, county, city and local statistics and may differ in a specific area. Last updated: 2026-05-01T13:39:35.000Z
Narrative content on this page is AI-generated and may contain mistakes. Verify any details that matter before acting on them.
ReloMaps may earn a commission from affiliate links at no extra cost to you.