
Photo: Wikipedia
Demographics of Sebastian County
Affluence Level in Sebastian County
A middle-class area roughly in line with national averages across income, home values, education, and employment.
People of Sebastian County
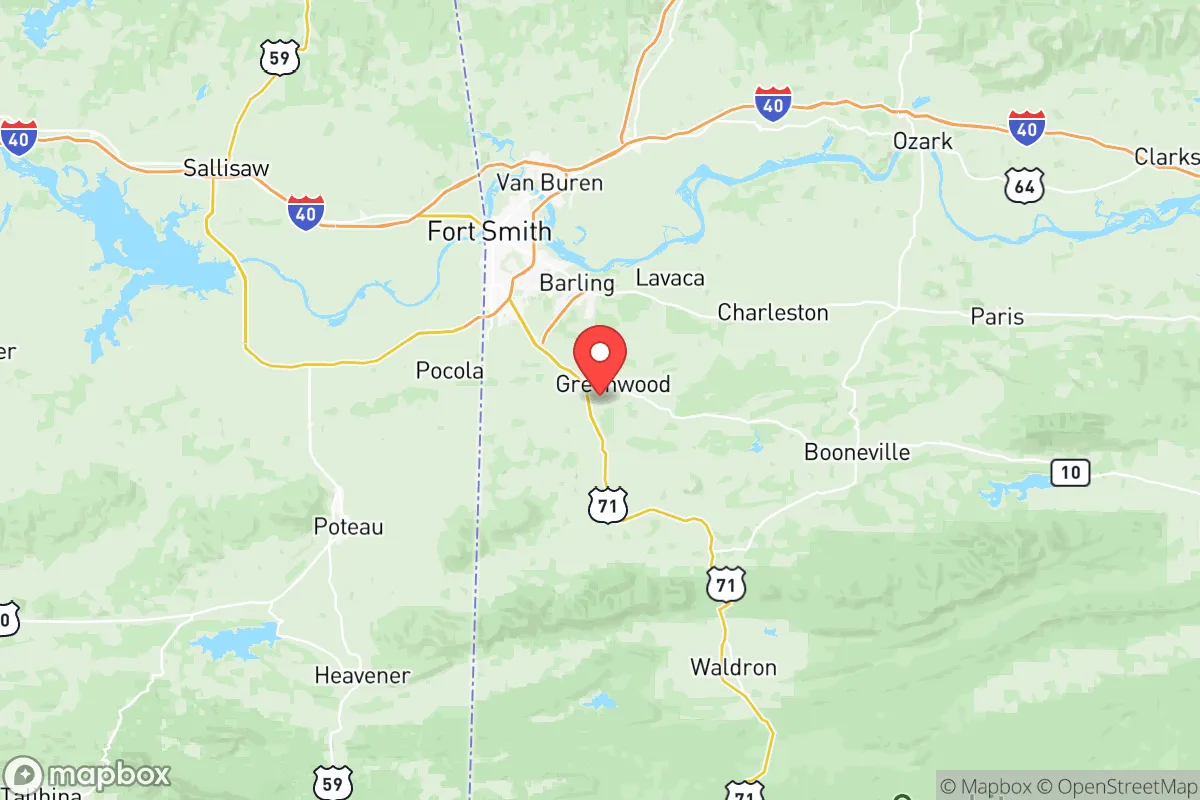
Sebastian County's 128,448 residents form a community shaped by its dual role as a manufacturing and regional service hub along the Arkansas-Oklahoma border, anchored by the twin cities of Fort Smith and Greenwood. The population is predominantly white (66.8%) with a substantial Hispanic minority (15.6%) and smaller Black (5.7%) and East/Southeast Asian (3.9%) communities, creating a demographic profile that is more diverse than much of western Arkansas but still distinctly less diverse than the national average. With only 5.0% foreign-born and 24.4% college-educated, the county retains a working-class character rooted in its industrial past, though recent growth in healthcare, logistics, and back-office employment is slowly reshaping its economic and social identity.
Settlement & growth (pre-1960)
Long before European settlement, the area that is now Sebastian County was a contested borderland between the Osage and the Caddo Confederacy, with the Arkansas River serving as a major travel and trade corridor. The Osage dominated the region by the time of first French contact in the late 1600s, and the area remained under nominal French and then Spanish control until the Louisiana Purchase of 1803. No permanent European settlements existed within the county's boundaries during the colonial period; the land was primarily used for hunting and as a buffer zone between competing Native nations.
American settlement began in earnest after the 1820 Treaty of Doak's Stand and the subsequent forced removal of the Caddo and Quapaw. The first wave of Anglo-American settlers, predominantly Scots-Irish and English migrants from Tennessee, Kentucky, and Missouri, arrived in the 1820s and 1830s, drawn by cheap land under the Preemption Act of 1841 and later the Homestead Act of 1862. They established small farms along the Arkansas River bottoms and founded the county's earliest communities, including Fort Smith (established as a military post in 1817, incorporated as a town in 1842) and Greenwood (settled in the 1830s, incorporated in 1851). These early settlers were overwhelmingly subsistence farmers, and the county's population remained sparse — fewer than 5,000 residents by 1850.
The county's demographic character shifted dramatically with the arrival of the railroad in the 1870s and 1880s. The Little Rock and Fort Smith Railway (completed 1875) and the St. Louis and San Francisco Railway (the "Frisco," which reached Fort Smith in 1882) transformed Fort Smith from a sleepy river town into a regional transportation and manufacturing hub. This period brought a second wave of settlers: German and Irish immigrants who worked as railroad laborers and later settled in Fort Smith's working-class neighborhoods, particularly the Belle Grove and Chaffee Crossing areas. By 1890, the county's population had grown to over 30,000, with Fort Smith emerging as the dominant urban center.
The early 20th century brought a third wave: African American migrants from the Deep South, particularly Mississippi and Louisiana, who arrived between 1900 and 1930 seeking work in Fort Smith's lumber mills, furniture factories, and the growing railroad yards. They established a vibrant community centered on the Dodson Avenue corridor in Fort Smith's north side, with its own churches, businesses, and a segregated school system that persisted until the 1960s. By 1930, Black residents made up roughly 12% of the county's population, a share that would decline in subsequent decades due to out-migration and suburbanization.
The Dust Bowl and Great Depression of the 1930s brought a fourth wave: white "Okie" and "Arkies" from the drought-stricken Arkansas Delta and Oklahoma Panhandle, who settled in the county's rural areas and in the mill villages of Barling and Lavaca. These migrants were largely poor, rural whites who worked in the county's timber and furniture industries, and their arrival reinforced the county's overwhelmingly white, Protestant, and socially conservative character. The post-World War II period saw a fifth wave: returning veterans and their families, who took advantage of the GI Bill to buy homes in new subdivisions like Park Hill in Fort Smith and the expanding town of Greenwood. By 1960, the county's population had reached 66,685, with Fort Smith accounting for roughly 60% of the total.
Modern era (post-1965)
The 1965 Hart-Cellar Act had a modest but measurable impact on Sebastian County compared to coastal or Sun Belt boom regions. The county's foreign-born population today stands at just 5.0%, well below the national average of roughly 14%, but this represents a significant increase from the near-zero levels of the 1960s. The most notable post-1965 immigrant group has been Hispanic migrants, primarily from Mexico and Central America, who began arriving in the 1980s and 1990s to work in the county's poultry processing plants (particularly at the Simmons Foods facility in Van Buren, just across the river in Crawford County) and in construction and landscaping. Today, Hispanic residents make up 15.6% of the county's population, with the largest concentrations in Fort Smith's south side and in the unincorporated community of Moffett. The Hispanic community has established a growing network of churches, grocery stores, and service organizations, and the county's public schools now serve a student body that is roughly 25% Hispanic.
A smaller but significant post-1965 wave has been East and Southeast Asian immigrants, particularly Vietnamese and Filipino refugees and their families, who arrived in two phases: first, a small number of Vietnamese refugees resettled by Catholic and Protestant charities after the fall of Saigon in 1975; and second, a larger wave of Filipino healthcare workers recruited by the county's hospitals and nursing homes in the 1990s and 2000s. Today, East/Southeast Asian residents make up 3.9% of the county's population, with a visible presence in Fort Smith's medical district around Sparks Regional Medical Center and Mercy Hospital Fort Smith. The Indian-subcontinent population remains tiny at 0.3%, concentrated among a small number of professionals in healthcare and engineering.
Domestic migration has been the larger driver of demographic change since 1965. The county has experienced steady in-migration from California and the Pacific Northwest since the 1990s, as retirees and remote workers have been drawn by lower housing costs and a lower cost of living. This "coastal flight" has been particularly visible in Greenwood, which has grown from a town of 3,000 in 1990 to over 9,000 today, and in the Chaffee Crossing development on Fort Smith's east side, a former Army ammunition plant that has been redeveloped into a mixed-use community of homes, businesses, and a regional medical school. At the same time, the county has lost population through out-migration of young adults to larger metropolitan areas like Fayetteville and Dallas, a pattern that has kept the county's college attainment rate low (24.4%) and its median age relatively high (38.5).
Suburbanization has reshaped the county's settlement patterns since the 1970s. Fort Smith's population has grown slowly (roughly 90,000 today, up from 72,000 in 1970), while the surrounding towns of Greenwood, Barling, and Lavaca have grown rapidly as bedroom communities. The county's Black population has declined from its 1930 peak of 12% to 5.7% today, driven by out-migration to larger cities and by the annexation of predominantly white suburban areas into the city limits. The Hispanic population, by contrast, has grown steadily and is now the county's fastest-growing demographic group, with a growth rate of roughly 3% per year since 2010.
The future
Sebastian County is becoming more diverse, but slowly. The Hispanic share of the population is projected to reach 20-22% by 2040, driven by both continued immigration and higher birth rates among Hispanic families. The East/Southeast Asian share is likely to grow modestly, to perhaps 5-6%, as the county's healthcare and manufacturing sectors continue to recruit skilled immigrants. The Black share is expected to remain stable or decline slightly, as out-migration to larger cities continues to offset any in-migration. The white share, while still a majority, will continue to decline gradually, from 66.8% today to perhaps 60-62% by 2040.
The geographic pattern of growth is shifting. The county's rural areas are likely to continue losing population, while the urban core of Fort Smith and the suburban towns of Greenwood and Barling will absorb most new residents. The Chaffee Crossing development is expected to add 5,000-7,000 new residents over the next decade, many of them younger professionals and families drawn by the area's new medical school and technology park. The county's cultural identity is evolving from a purely white, working-class, Baptist-dominated culture to a more pluralistic one, though the pace of change is slow enough that the county will remain socially conservative and politically Republican for the foreseeable future.
For someone moving in now, Sebastian County offers a relatively affordable, safe, and family-oriented environment with a growing diversity that is still modest by national standards. The county's demographic trajectory suggests a place that is becoming more Hispanic and more suburban, but not dramatically more cosmopolitan or liberal. The key question for newcomers is whether they value the stability and low cost of a slow-growth, culturally traditional region, or whether they seek the dynamism and diversity of a faster-changing metropolitan area. Sebastian County is firmly in the former camp, and its demographic future reflects that choice.

* Values derived from national, state, county, city and local statistics and may differ in a specific area. Last updated: 2026-08-08T12:33:11.000Z
Narrative content on this page is AI-generated and may contain mistakes. Verify any details that matter before acting on them.
ReloMaps may earn a commission from affiliate links at no extra cost to you.

