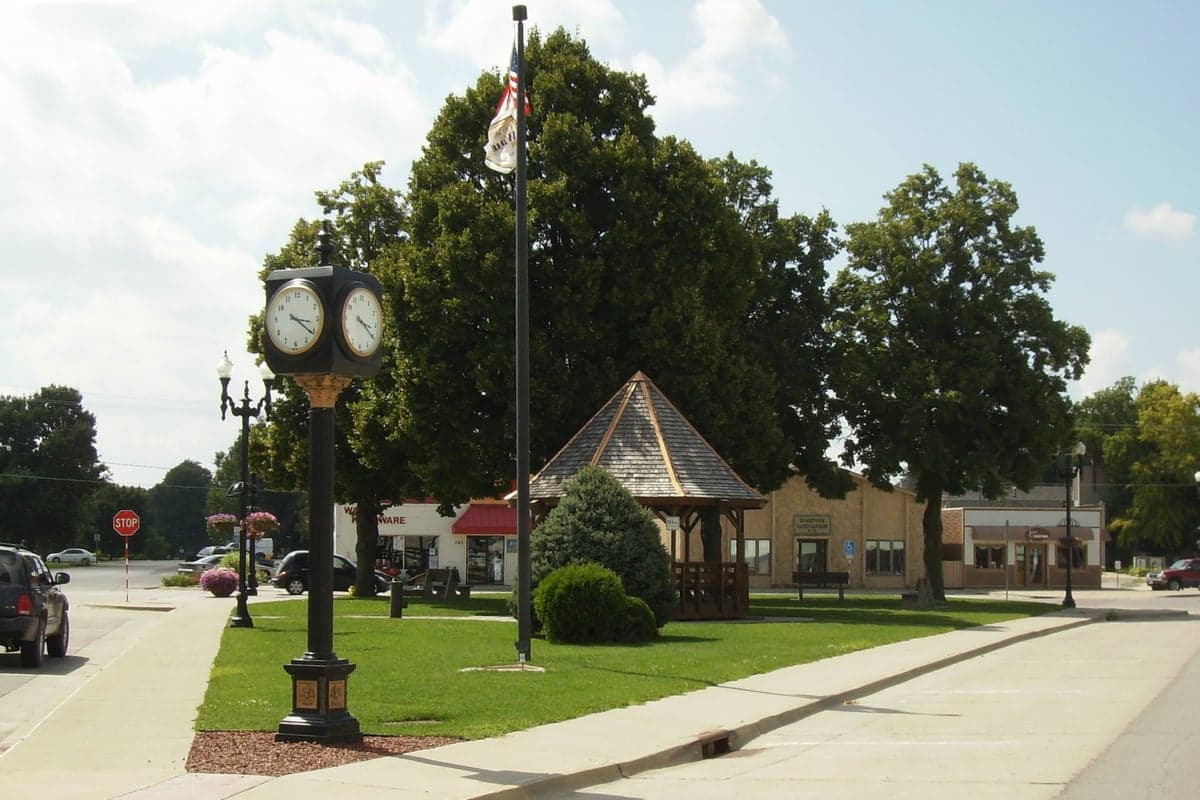
Photo: Wikipedia
Demographics of Waukee, IA
Affluence Level in Waukee, IA
A middle-class area roughly in line with national averages across income, home values, education, and employment.
People of Waukee, IA
The people of Waukee, Iowa, today number 26,974, forming a rapidly growing, predominantly white (77.1%) suburban community with a notably high college attainment rate of 56.7%. The city’s character is defined by its blend of established farming families and a wave of young, professional newcomers drawn by the Des Moines metro’s job growth and the Waukee Community School District’s reputation. A distinctive identity marker is the city’s significant Indian-subcontinent population (5.0%), which is concentrated in newer developments and reflects a tech-and-medical professional migration pattern distinct from the broader Asian (East/Southeast Asian) community (1.5%). The population is young, family-oriented, and increasingly diverse, with a foreign-born share of 5.7% that is growing faster than the state average.
How the city was settled and grew
Waukee’s original population was drawn by the railroad and the promise of fertile farmland in the late 19th century. The town was platted in 1878 along the Chicago, Rock Island and Pacific Railroad line, attracting a mix of Yankee settlers from the eastern U.S. and German and Scandinavian immigrants who worked the surrounding corn and oat fields. These early residents built the historic Downtown Waukee district along Hickman Road, where the original grain elevator and general stores anchored a tight-knit, agricultural community. A second wave of settlement came in the 1910s and 1920s as Dutch and Danish families arrived, establishing dairy farms and the Ridgewood area west of the railroad tracks. For most of the 20th century, Waukee remained a small farming town of fewer than 2,000 people, with population growth limited by the lack of major industry and its position as a quiet stop between Des Moines and Adel.
Modern era (post-1965)
The modern transformation of Waukee began in earnest after the 1965 Hart-Cellar Act, but the real domestic in-migration surge started in the 1990s as Des Moines’ suburban sprawl pushed westward. The opening of the Waukee High School in 1998 and the construction of the Shuler Elementary area subdivisions—like the Country Club neighborhood—attracted white, college-educated families from the Des Moines metro seeking newer, larger homes and top-rated schools. The 2000s and 2010s saw a second domestic wave: young professionals and corporate transferees from companies like Wells Fargo and Principal Financial, who settled in master-planned communities such as Kettlestone and South Meadows. These areas absorbed the bulk of the city’s population growth, which jumped from 5,126 in 2000 to 13,940 in 2010 and then to 26,974 by 2025.
The Indian-subcontinent population (5.0%) is a notable modern addition, concentrated heavily in the Kettlestone and Stonegate neighborhoods—areas built after 2010 with larger homes and proximity to the new Waukee Innovation and Learning Center. These residents are predominantly professionals in IT, engineering, and healthcare, drawn by the Des Moines area’s growing tech sector and the school district’s STEM programs. The East/Southeast Asian community (1.5%) is smaller and more dispersed, with families living in the South Meadows area and older parts of the Country Club neighborhood. The Hispanic population (5.9%) and Black population (4.3%) are more evenly spread across the city, with Hispanic families often settling in the Downtown area and older rental stock near the railroad corridor, while Black residents are found in both newer subdivisions and the Ridgewood area.
The future
Waukee’s population is heading toward continued growth and moderate diversification, but not toward rapid homogenization. The city is projected to reach 35,000–40,000 by 2035, driven by annexation of farmland to the west and north and the construction of new subdivisions like West View and Prairie Trail. The Indian-subcontinent community is likely to grow further, as tech and medical employers in the metro continue to recruit internationally, and this group is showing signs of forming a distinct enclave in the western neighborhoods. The Hispanic and Black populations are growing more slowly, plateauing as housing prices rise and push lower-income families to more affordable suburbs like Adel or Perry. The white, college-educated majority is expected to remain dominant, but the city is becoming less tribal and more integrated in daily life—schools, sports leagues, and community events like the Waukee Corn Festival see broad participation across groups. The next 10–20 years will likely see Waukee become a more diverse, but still majority-white, professional-class suburb, with the Indian-subcontinent community solidifying as the largest minority group.
For someone moving in now, Waukee is becoming a prosperous, family-oriented suburb where the old farming roots are fading and a new, tech-and-education-driven identity is taking hold. The population is young, well-educated, and increasingly international in its professional class, but the city remains socially cohesive and politically moderate to conservative. The key takeaway: Waukee offers a high-quality school system and a growing, diverse community where newcomers—especially professionals—will find a welcoming environment, but housing costs are rising and the city is becoming less affordable for lower-income families.
* Values derived from national, state, county, city and local statistics and may differ in a specific area. Last updated: 2026-05-03T04:50:20.000Z
Narrative content on this page is AI-generated and may contain mistakes. Verify any details that matter before acting on them.
ReloMaps may earn a commission from affiliate links at no extra cost to you.