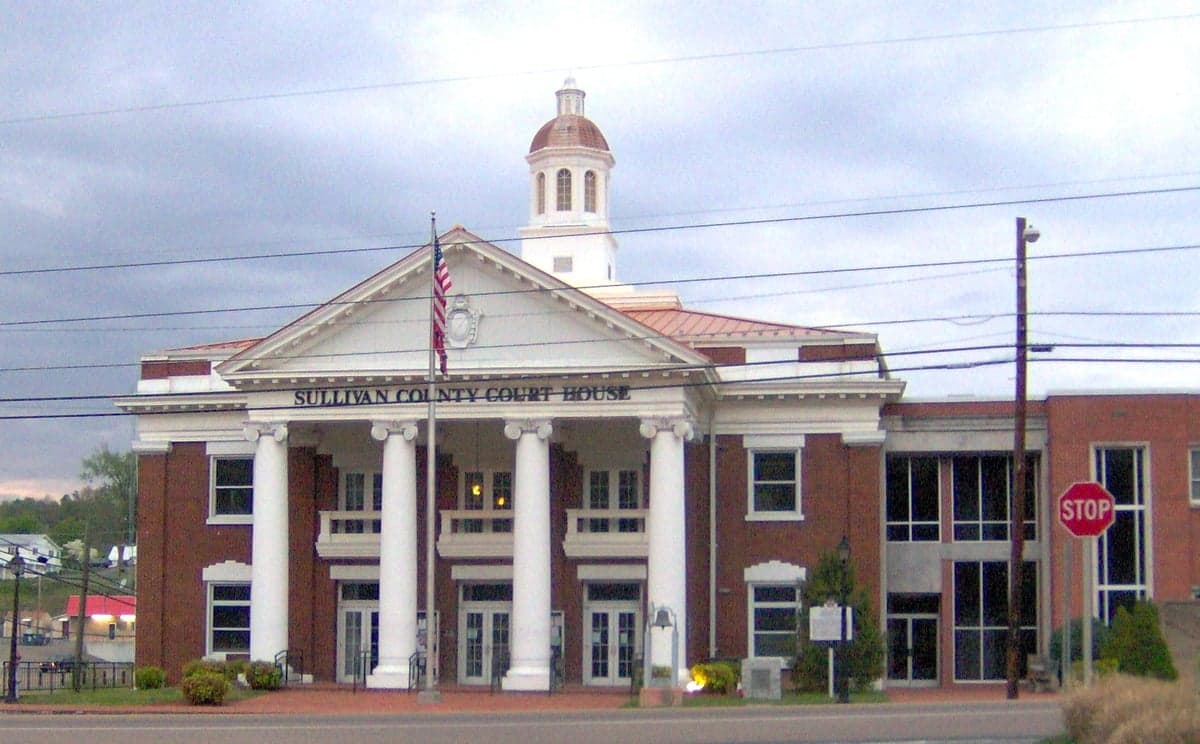
Photo: Wikipedia
Demographics of Sullivan County
Affluence Level in Sullivan County
A middle-class area roughly in line with national averages across income, home values, education, and employment.
People of Sullivan County
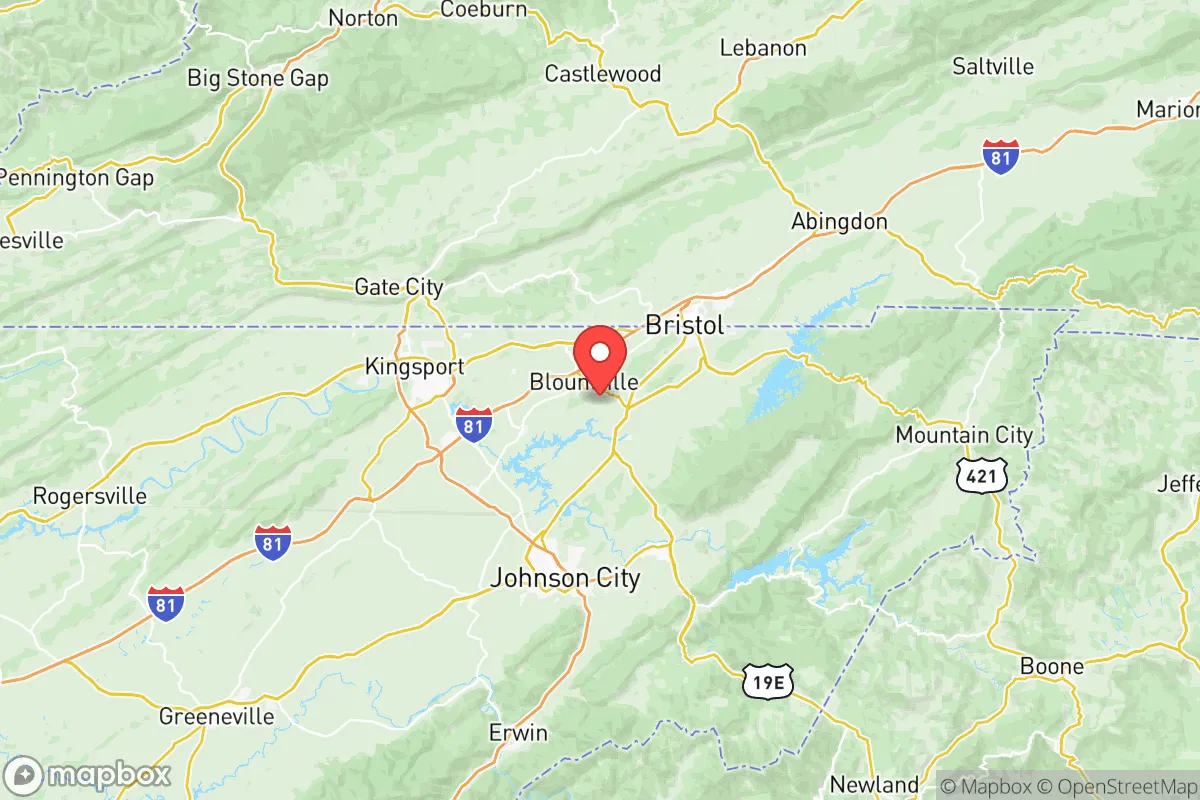
The people of Sullivan County, Tennessee, today form a predominantly white, native-born population of roughly 160,000, characterized by a strong sense of regional identity rooted in Appalachian and Scots-Irish heritage. With a foreign-born share of just 0.8% and a population that is 92.1% white, the county remains one of the least ethnically diverse in Tennessee, a direct reflection of its settlement history and limited immigration since the mid-20th century. The population is concentrated in the Tri-Cities metropolitan area, with the county seat of Blountville, the largest city of Kingsport, and the historic river town of Bristol serving as the primary population centers. This is a place where family ties run deep, church attendance is high, and the cultural identity remains distinctly Southern Appalachian, shaped by centuries of relative isolation and a single dominant founding population.
Settlement & growth (pre-1960)
Long before European settlement, the area now known as Sullivan County was part of the hunting grounds of the Cherokee Nation, with the Great Indian Warpath running through the region along the Holston River. The Cherokee maintained several small villages along the riverbanks, but the area was not densely settled by Native Americans, serving more as a corridor and seasonal hunting territory. French fur traders passed through in the 17th century, but no permanent European settlement occurred until after the Anglo-Cherokee wars of the mid-1700s.
The first permanent European settlers arrived in the 1760s and 1770s, overwhelmingly Scots-Irish Presbyterians migrating down the Great Wagon Road from Pennsylvania, Virginia, and North Carolina. These were frontier families seeking cheap land and freedom from the established Tidewater aristocracy. They settled along the Holston and Watauga Rivers, founding the earliest communities that would become Blountville (established 1795 as the county seat) and Bristol (founded 1856 on the Virginia border). The Scots-Irish brought with them a fierce independence, a suspicion of distant government, and a culture of self-reliance that remains a hallmark of the region today. Sullivan County was officially formed in 1779, named for Governor John Sullivan of New Hampshire, and was one of the original counties of the State of Franklin before Tennessee statehood.
Through the 19th century, the population grew slowly, supplemented by English and German settlers who arrived via the same overland routes. The county remained overwhelmingly agricultural, with small farms producing tobacco, corn, and livestock. The arrival of the railroad in the 1850s, particularly the East Tennessee and Virginia Railroad, connected Sullivan County to broader markets and spurred the growth of Bristol as a commercial hub. The Civil War divided the county, as East Tennessee was largely Unionist in sentiment while the rest of the state seceded, but the population remained almost entirely native-born white, with very few enslaved people — the 1860 census recorded only about 1,200 enslaved individuals in a county of roughly 12,000 people.
The single most transformative event in Sullivan County's population history was the founding of Kingsport as a planned industrial city in the 1910s. The Kingsport Improvement Company, backed by northern capital, created a model industrial community built around the Kingsport Press (a major printing plant), the Tennessee Eastman Company (a chemical plant), and the Borden Mills textile factory. This drew a new wave of domestic migrants: white Appalachian farmers leaving exhausted mountain land, along with smaller numbers of skilled workers from the Northeast and Midwest. Kingsport grew from a village of a few hundred in 1900 to over 11,000 by 1930, becoming the county's largest city. The industrial base expanded further during World War II, when Tennessee Eastman (later Eastman Chemical Company) became a major supplier of synthetic materials for the war effort, pulling in additional workers from across the rural South.
Throughout the pre-1960 period, Sullivan County experienced virtually no immigration from outside the United States. The foreign-born population in 1960 was under 1%, consisting mostly of a handful of German and Italian engineers brought in by Eastman Chemical and a small community of Syrian-Lebanese merchants who settled in Bristol and Kingsport in the early 1900s, operating dry goods stores. The county's black population, never large, was concentrated in a few small neighborhoods in Kingsport and Bristol, with most working in domestic service or at the industrial plants. The dominant cultural identity remained Scots-Irish Appalachian, with Baptist and Methodist churches forming the social backbone of every community from Bloomingdale to Colonial Heights.
Modern era (post-1965)
The 1965 Hart-Cellar Act, which dramatically expanded immigration from Asia, Latin America, and Africa, had almost no impact on Sullivan County. The foreign-born population today stands at just 0.8%, a figure that has barely budged since 1970. The county did not experience the post-1965 immigration waves that transformed cities like Nashville, Memphis, or even nearby Knoxville. Instead, the demographic story of the modern era is one of domestic out-migration and suburbanization.
From the 1970s through the 1990s, Sullivan County lost population as the industrial base contracted. Eastman Chemical downsized, Kingsport Press closed in 1980, and textile mills moved overseas. Young adults left for college and did not return, seeking jobs in Charlotte, Atlanta, and Nashville. The population fell from a peak of roughly 160,000 in 1980 to about 153,000 by 2000. The county's white share remained above 95% throughout this period, as the small black population also declined due to out-migration to larger Southern cities.
The 21st century brought a modest reversal. Sullivan County's population has grown slowly, reaching 159,693 by 2025, driven by two trends: retirees from the Rust Belt (Ohio, Michigan, Illinois) seeking lower costs and milder winters, and returning natives who left in the 1980s and 1990s and are now coming back to retire or care for aging parents. These new residents are overwhelmingly white and native-born, reinforcing the county's existing demographic character. The small Hispanic population (2.4%) is concentrated in Kingsport and Bristol, working in construction, landscaping, and poultry processing. The even smaller East/Southeast Asian population (0.5%) consists primarily of professionals employed by Eastman Chemical and the medical sector, living in Kingsport and the Colonial Heights area. The Indian-subcontinent population (0.4%) is similarly small and professional, with a handful of doctors at Ballad Health hospitals in Bristol and Kingsport.
Suburbanization has reshaped the county's internal geography. The unincorporated areas around Colonial Heights and Bloomingdale have grown as bedroom communities for Kingsport and Bristol, while the historic downtowns of both cities have struggled with vacancy and disinvestment. The county's population is now spread relatively evenly across the urbanized corridor along Interstate 81, with no single municipality holding a majority.
The future
Sullivan County's population is likely to remain overwhelmingly white and native-born for the foreseeable future. The foreign-born share may inch up to 1.5-2% over the next decade, driven by Hispanic workers in construction and food processing, and by a small number of Asian and Indian professionals in the medical and chemical sectors. But the county lacks the economic dynamism, university presence, or cultural diversity to attract significant immigration. The population is aging — the median age is 43, well above the national average — and natural increase (births minus deaths) has turned negative in recent years, meaning all growth comes from in-migration.
The most likely demographic scenario is a slow homogenization: the county will become slightly more Hispanic and slightly more Asian, but these groups will remain small and geographically concentrated. The dominant cultural identity — white, Southern Appalachian, conservative, churchgoing — will persist, reinforced by the continued in-migration of Rust Belt retirees who share similar values. The county is not tribalizing into distinct ethnic enclaves; rather, it is absorbing its small minority populations into a broader regional culture. The next 10-20 years will likely see continued slow growth, an older population, and a cultural landscape that looks much like it does today, only with more subdivisions and fewer family farms.
For someone moving into Sullivan County now, the bottom line is clear: this is a place where the population is stable, culturally cohesive, and unlikely to change dramatically. The county offers a low-cost, low-crime, family-oriented environment with strong community institutions, but it is not a place of demographic dynamism or diversity. New arrivals will find a population that is welcoming to those who share its values and way of life, but that has little experience with or exposure to significant cultural difference. The county is becoming a quieter, older, and slightly more suburban version of its historic self — a place where the past remains very much present in the people who call it home.
* Values derived from national, state, county, city and local statistics and may differ in a specific area. Last updated: 2026-05-20T09:47:44.000Z
Narrative content on this page is AI-generated and may contain mistakes. Verify any details that matter before acting on them.
ReloMaps may earn a commission from affiliate links at no extra cost to you.