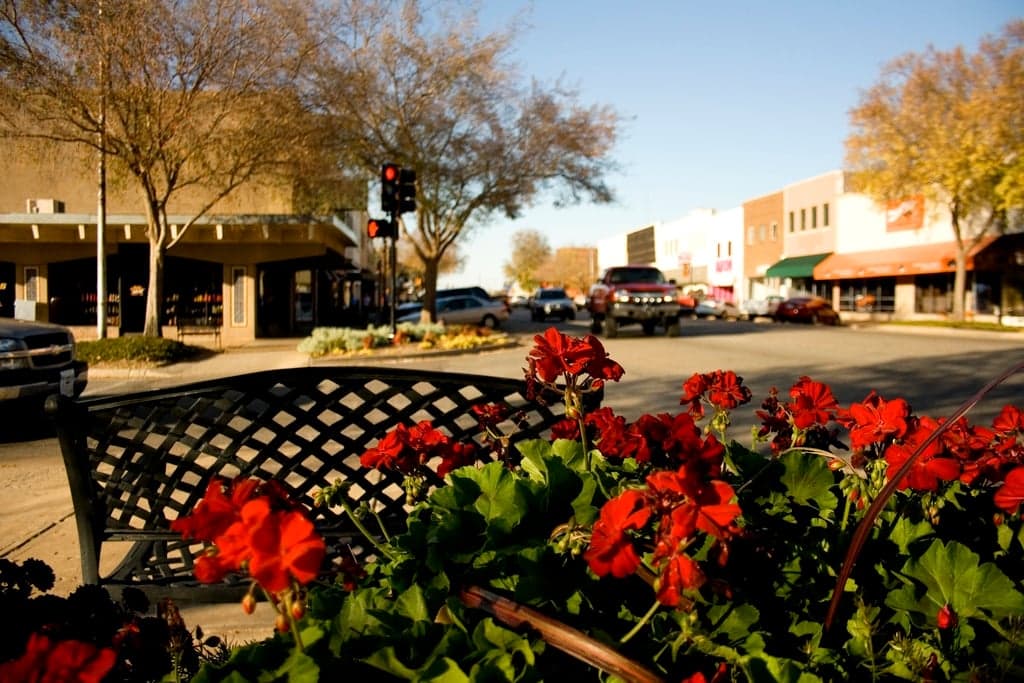
Photo: Wikipedia
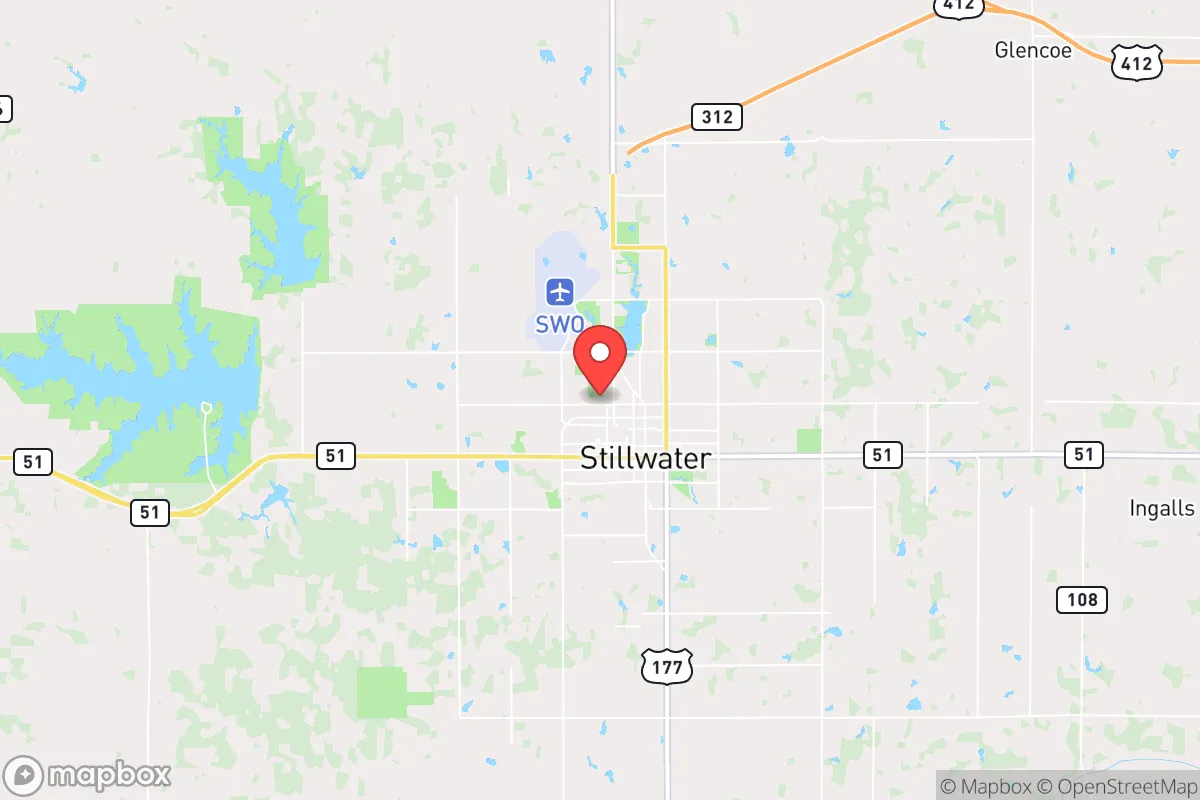
Demographics of Stillwater, OK
Affluence Level in Stillwater, OK
A middle-class area roughly in line with national averages across income, home values, education, and employment.
People of Stillwater, OK
The people of Stillwater, Oklahoma today number 48,818, forming a community that is predominantly white (71.7%) but notably more diverse than much of rural Oklahoma, with a college-educated rate of 51.9% that reflects the city’s identity as a university town anchored by Oklahoma State University. The city’s character is defined by a blend of long-standing agricultural roots, a transient student population, and a growing professional class drawn to the university and the nearby energy sector. Distinctive identity markers include a relatively high foreign-born share of 7.0%, a visible East/Southeast Asian community (3.6%) tied to university research programs, and a separate Indian-subcontinent population (2.5%) concentrated among faculty and graduate students. Stillwater is neither a booming Sun Belt suburb nor a shrinking Plains town—it is a stable, mid-sized college city where demographic change is gradual and largely driven by institutional hiring rather than broad migration waves.
How the city was settled and grew
Stillwater was founded during the Oklahoma Land Run of 1889, when the Unassigned Lands were opened to non-Native settlement. The original population was overwhelmingly white and native-born, drawn by the promise of 160-acre homesteads under the Homestead Act. Early settlers were farmers and ranchers from the Midwest and Upper South, and they built the first neighborhoods around the downtown core, including the Hackett Addition (platted in 1890) and the Westwood Addition, which housed merchants and tradesmen. The arrival of the Eastern Oklahoma Railway in 1899 spurred growth, and the establishment of Oklahoma A&M College (now OSU) in 1890 created a permanent institutional anchor. By 1910, Stillwater’s population had reached roughly 4,000, almost entirely white and native-born. The city’s black population, though small, formed a distinct community in the Booker T. Washington Addition (often called “the Bottom”), a segregated neighborhood south of the railroad tracks that persisted through the mid-20th century. No significant immigrant waves arrived during this period; the foreign-born share remained below 2% until after World War II.
Modern era (post-1965)
The 1965 Hart-Cellar Immigration Act had a delayed but measurable effect on Stillwater. The city’s foreign-born share rose from under 2% in 1970 to 7.0% today, driven almost entirely by OSU’s expansion of graduate programs and international recruitment. The largest post-1965 group has been East/Southeast Asian students and faculty—primarily Chinese, Korean, and Vietnamese—who settled in rental-heavy neighborhoods near campus such as the University Addition and the Cimarron Hills area. A separate Indian-subcontinent community (2.5%) grew in the 1990s and 2000s, concentrated among engineering and business faculty, and is most visible in the Lakeview and Richmond Hills subdivisions, where many university professionals own homes. The Hispanic population (6.2%) expanded more gradually, driven by labor migration to agriculture and construction; these households are concentrated in the South Perkins Road corridor and older rental stock near downtown. The black population (4.7%) has remained relatively stable, with many families tracing roots to the historic Booker T. Washington Addition, though that neighborhood has become more mixed as university housing expanded. Domestic in-migration since 1965 has been modest—Stillwater is not a major destination for Sun Belt retirees or remote workers—and most new white residents are students or university employees who cycle through every few years.
The future
Stillwater’s population is likely to remain stable or grow slowly, with the foreign-born share plateauing around 7-8% as OSU’s international enrollment faces headwinds from national visa policy and competition from other universities. The East/Southeast Asian and Indian communities are not tribalizing into permanent enclaves; instead, they are assimilating into the broader professional class, with second-generation children attending OSU or leaving for larger cities. The Hispanic population may grow slightly, driven by family reunification and service-sector jobs, but is unlikely to exceed 8-10% of the total. The white population will remain the overwhelming majority, though its share may decline slowly as the university diversifies its faculty. The city is not homogenizing—neighborhoods like the University Addition and Cimarron Hills will retain a transient, international character—but neither is it fragmenting into distinct ethnic enclaves. The most notable trend is the aging of the native-born white population, as younger graduates often leave for job markets in Oklahoma City or Dallas, while the university continues to import a steady stream of new residents.
For someone moving to Stillwater now, the city offers a stable, university-centered community where demographic change is incremental and largely contained within the professional and academic spheres. The population is becoming slightly more diverse with each decade, but the pace is slow enough that the city’s character—rooted in OSU, agriculture, and a conservative-leaning civic culture—will remain recognizable for the foreseeable future. New arrivals should expect a place where the dominant identity is still “college town” rather than “melting pot,” and where most diversity is concentrated in specific neighborhoods near campus rather than spread across the city.
* Values derived from national, state, county, city and local statistics and may differ in a specific area. Last updated: 2026-04-21T09:09:26.000Z
Narrative content on this page is AI-generated and may contain mistakes. Verify any details that matter before acting on them.
ReloMaps may earn a commission from affiliate links at no extra cost to you.