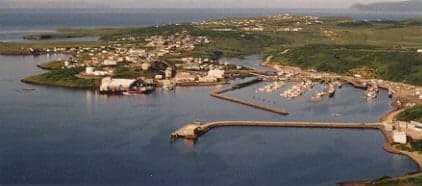
Photo: Wikipedia
Demographics of Sand Point, AK
Affluence Level in Sand Point, AK
A middle-class area roughly in line with national averages across income, home values, education, and employment.
People of Sand Point, AK
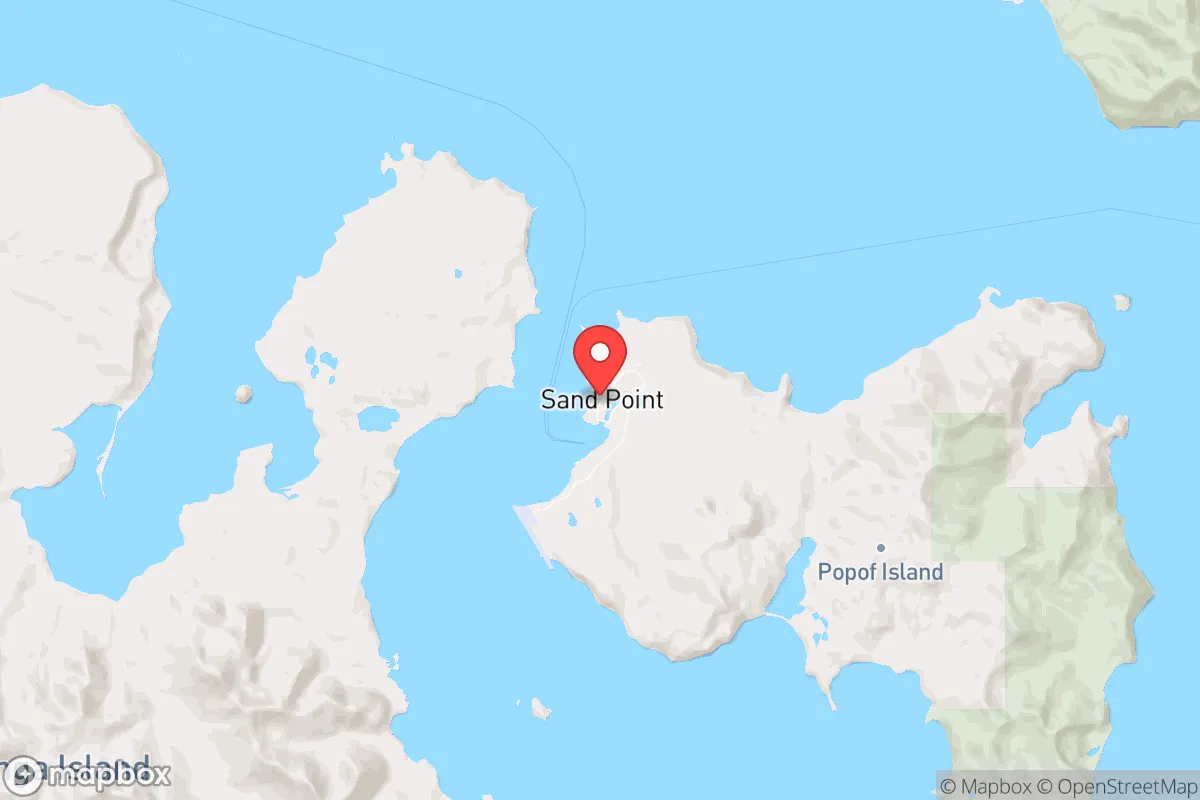
Sand Point, Alaska, is a tight-knit fishing community of 1,146 residents where East and Southeast Asian heritage defines the population—22.4% of residents identify as Asian, primarily Filipino and Vietnamese families who arrived through the seafood industry. The city’s character is shaped by its remote Aleutian Islands location, a working waterfront economy, and a population density of roughly 200 people per square mile. Distinctive identity markers include a strong union presence in the fish processing plants, a high proportion of foreign-born residents at 21.7%, and a notably low college attainment rate of 16.7%, reflecting the blue-collar, trade-focused nature of the workforce.
How the city was settled and grew
Sand Point’s human history begins with the Aleut (Unangan) people, who used the area as a seasonal fishing and hunting camp for centuries before European contact. The first permanent settlement by outsiders came in the late 19th century when Russian and American fur traders established outposts, though no large village formed until the 1930s. The modern city was effectively founded in the 1940s when the U.S. military built an airfield and dock during World War II, drawing a small workforce of Euro-American servicemen and construction laborers. The real population boom came after the war, when the Alaska Packers Association and other seafood companies established fish processing plants. The Dock District, the original waterfront neighborhood, was built by these early cannery workers—mostly white migrants from the Pacific Northwest and a handful of Filipino laborers who arrived under contract. By the 1950s, the Hilltop area above the harbor housed the families of plant managers and year-round residents, while seasonal workers lived in company bunkhouses near the docks.
Modern era (post-1965)
The 1965 Immigration and Nationality Act opened the door for a dramatic demographic shift. Filipino and Vietnamese workers, recruited directly by seafood processors to fill labor shortages, began arriving in significant numbers during the 1970s and 1980s. These East and Southeast Asian immigrants settled primarily in the South Side neighborhood, where modest homes and duplexes were built by the companies to house permanent processing staff. By the 1990s, the Asian share of the population had risen to over 20%, and the Lagoon District—a newer residential area along the eastern shore—became a mixed enclave of Filipino families and white fishing boat captains. The white population, which had dominated through the 1960s, began a steady decline as younger Euro-American residents left for Anchorage or the Lower 48 for education and white-collar jobs. Today, white residents make up just 13.4% of the population, while the Black community (7.5%) consists largely of African American workers recruited from Louisiana and Mississippi for the crab and pollock fisheries in the 1990s. The Hispanic share (4.7%) is a smaller, more recent addition, primarily Mexican and Central American workers in the processing plants, concentrated in the West End near the newer cold storage facilities.
The future
Sand Point’s population is trending toward greater ethnic consolidation rather than homogenization. The East and Southeast Asian community, now the largest single group, shows signs of generational persistence: second-generation Filipino and Vietnamese residents often remain in the fishing industry or take on supervisory roles, maintaining the South Side and Lagoon District as stable ethnic enclaves. The foreign-born share (21.7%) has plateaued since 2010, suggesting that new immigration is slowing, but the Asian share is likely to grow slightly through higher birth rates among established families. The white population continues to shrink, as few young white families move in and the median age of white residents (over 50) is higher than the Asian median (mid-30s). The Black community is stable but small, with little new recruitment from the Gulf Coast. The city is not tribalizing into hostile enclaves—neighborhoods remain mixed in daily life—but distinct residential patterns persist by ethnicity and occupation. The next 10–20 years will likely see Sand Point become more uniformly Asian-majority, with a smaller white minority and a steady but modest Hispanic presence. The Hilltop area, once the white managerial enclave, is gradually being bought by Asian families moving up from the South Side.
For someone moving in now, Sand Point is becoming a place where the seafood industry remains the sole economic engine, and community life is organized around the plant schedules, the school (which serves fewer than 150 students), and the Orthodox and Catholic churches that serve the Filipino majority. The population is stable in number but shifting in composition—less white, more Asian, and increasingly multi-generational. New arrivals, especially those outside the fishing industry, will find a small, insular town where social networks are built through work and church, and where the cost of living is high due to shipping costs but housing remains affordable by Alaska standards. It is not a place of rapid change or growth, but of steady ethnic succession in a remote, resource-dependent setting.
* Values derived from national, state, county, city and local statistics and may differ in a specific area. Last updated: 2026-04-19T19:35:29.000Z
Narrative content on this page is AI-generated and may contain mistakes. Verify any details that matter before acting on them.
ReloMaps may earn a commission from affiliate links at no extra cost to you.