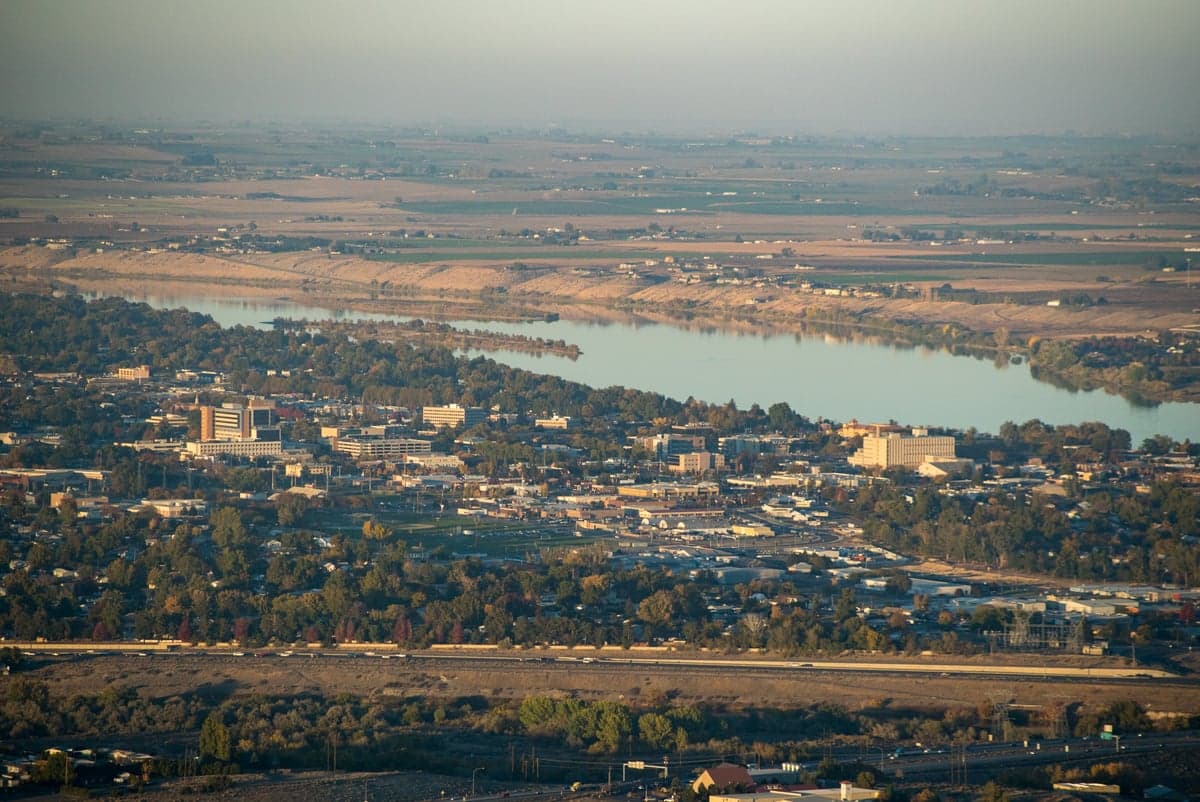
Photo: Wikipedia
Demographics of Richland, WA
Affluence Level in Richland, WA
A middle-class area roughly in line with national averages across income, home values, education, and employment.
People of Richland, WA
The people of Richland, Washington, today number 61,912, forming a predominantly white (73.6%) and highly educated (46.0% college-educated) community that retains a distinct nuclear-industry heritage. The city is notably less diverse than the national average, with a foreign-born population of just 3.5%, and its character remains shaped by the mid-century federal project that built it from scratch. This is a place where a planned, government-engineered workforce community has evolved into a stable, family-oriented suburb, with demographic shifts occurring slowly and primarily through domestic migration rather than international immigration.
How the city was settled and grew
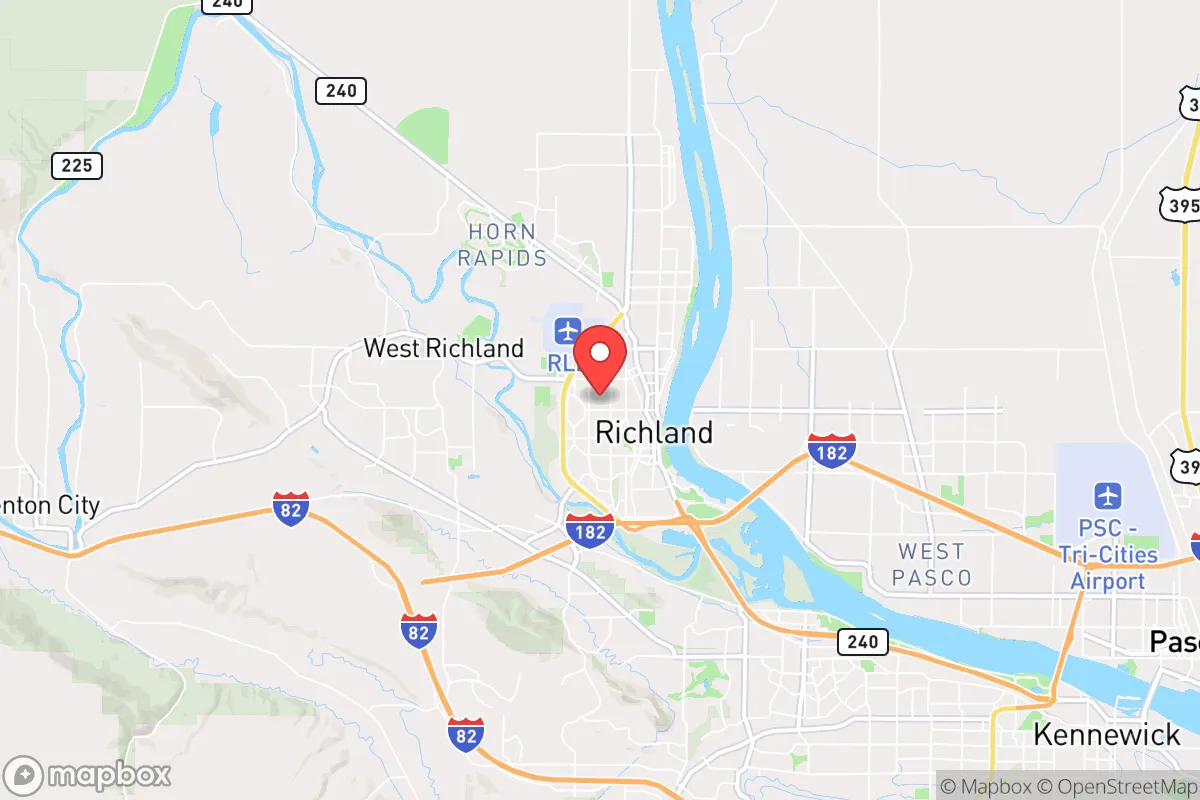
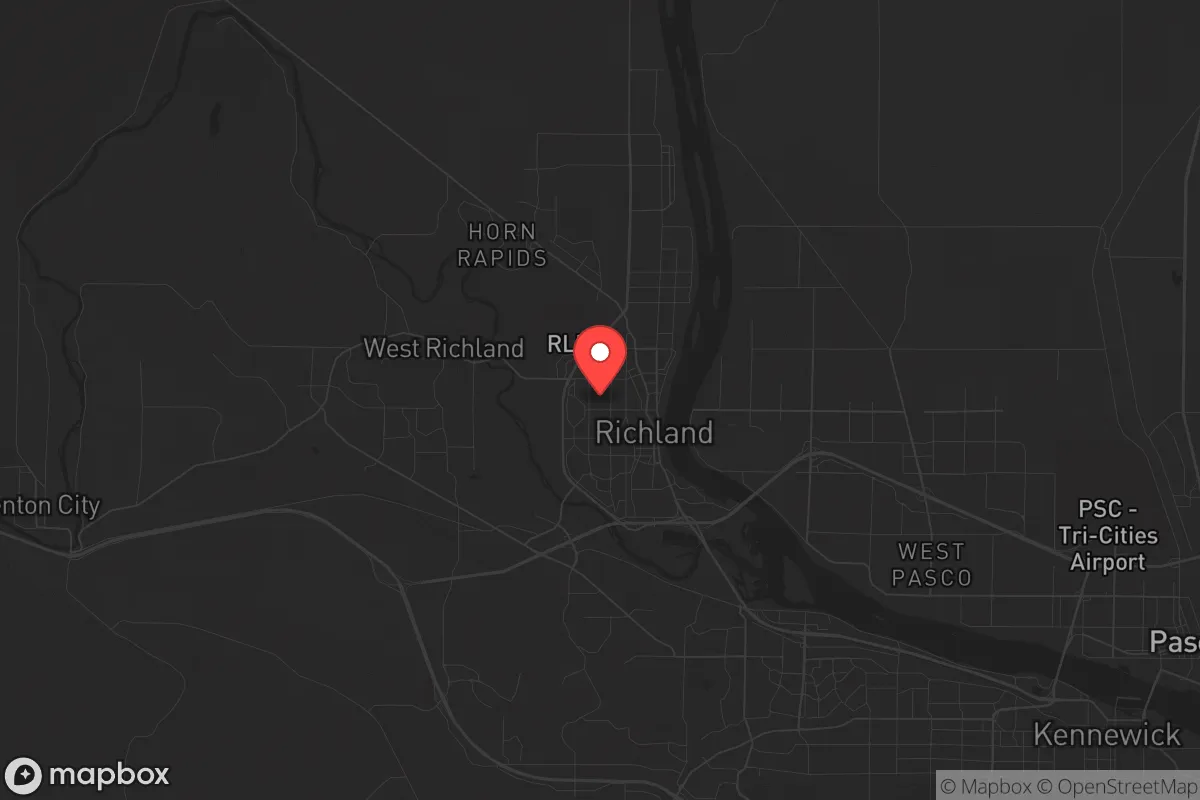
Richland has no pioneer or colonial history; it was effectively created in 1943 as a federal construction camp for the Manhattan Project’s Hanford Site. The U.S. Army Corps of Engineers and DuPont built the town in a matter of months to house the workers building the world’s first plutonium production reactors. The original population was a carefully selected, overwhelmingly white workforce of engineers, scientists, and construction laborers, many recruited from across the United States. These early residents were housed in standardized government-built housing in what is now the Central Richland Historic District, a neighborhood of wartime "alphabet houses" (A, B, C, D, and E types) that still stands today. A smaller number of African American workers, mostly laborers and service staff, were segregated into the Horn Rapids area on the city’s northern edge, though this population remained tiny and transient. After World War II, the federal government turned the town over to private ownership in 1958, and the population grew steadily through the Cold War as Hanford expanded plutonium production. The Meadow Springs neighborhood, developed in the 1950s and 1960s, absorbed many of the second-wave Hanford engineers and their families, solidifying the city’s professional-class character.
Modern era (post-1965)
The post-1965 era brought modest demographic diversification, but Richland remained far less affected by immigration than most U.S. cities. The 1980s and 1990s saw the Hanford Site shift from weapons production to environmental cleanup, which attracted a new wave of domestic migrants—scientists, project managers, and contractors—many of whom settled in the newer West Richland area (a separate city but functionally part of the same metro) and the South Richland neighborhoods near the Columbia River. The Hispanic population grew from negligible levels to 14.1% today, driven primarily by agricultural labor in the surrounding Yakima Valley and service-sector jobs in the Tri-Cities metro area. These families concentrated in older, more affordable housing stock in East Richland, near the border with Pasco, where rental properties and lower home prices are more common. The East/Southeast Asian population (3.6%) and Indian-subcontinent population (2.2%) are small but visible, largely composed of professionals employed at Hanford’s cleanup contractors, Pacific Northwest National Laboratory, and the Kadlec Regional Medical Center. These groups tend to settle in the newer subdivisions of Badger Mountain and Southridge, attracted by top-rated schools and newer housing stock. The Black population remains minimal at 1.3%, a legacy of the city’s planned white-collar origins and limited affordable housing.
The future
Richland’s population is heading toward slow, incremental diversification rather than rapid change. The Hispanic share is the fastest-growing segment, projected to reach 18-20% by 2040, driven by higher birth rates and continued migration from the Yakima Valley. However, this growth is occurring primarily in the lower-cost eastern neighborhoods, while the western and southern parts of the city remain overwhelmingly white and affluent. The East/Southeast Asian and Indian populations are likely to grow modestly as Hanford’s cleanup workforce ages and is replaced by younger professionals, but the city’s high housing costs (median home price above $450,000) and limited rental stock will constrain significant influx. The white population, while declining as a share, will remain the dominant group for the foreseeable future. The city is not tribalizing into distinct ethnic enclaves in the way larger metros do, but a subtle economic and geographic sorting is underway: wealthier, whiter neighborhoods on the west and south sides, and a more diverse, lower-income corridor along the eastern edge near Pasco.
For someone moving to Richland now, the bottom line is that this remains a predominantly white, highly educated, and stable community where demographic change is gradual and largely driven by domestic professional migration. The city’s identity as a Hanford-adjacent, family-oriented suburb is unlikely to shift dramatically in the next two decades, though the Hispanic population will continue to grow and the eastern neighborhoods will become more diverse. New arrivals should expect a community that values stability, education, and outdoor recreation, with a social fabric that is welcoming but not rapidly transforming.
* Values derived from national, state, county, city and local statistics and may differ in a specific area. Last updated: 2026-04-21T10:57:46.000Z
Narrative content on this page is AI-generated and may contain mistakes. Verify any details that matter before acting on them.
ReloMaps may earn a commission from affiliate links at no extra cost to you.