
Photo: Evan McNamara via Unsplash
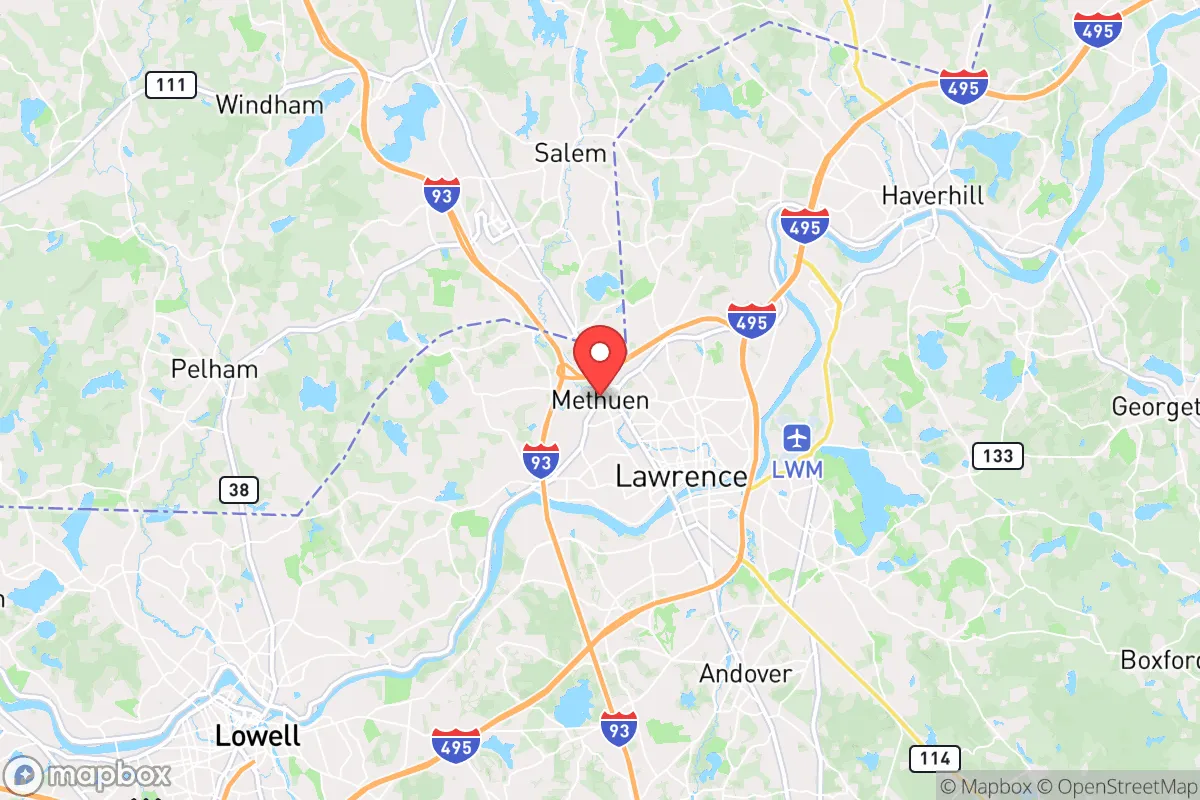
Demographics of Methuen Town, MA
Affluence Level in Methuen Town, MA
A middle-class area roughly in line with national averages across income, home values, education, and employment.
People of Methuen Town, MA
Methuen’s 53,043 residents today form a majority-minority city where 55.6% of the population identifies as White, 32.8% as Hispanic, 5.0% as Black, 1.8% as East/Southeast Asian, and 1.8% as Indian (subcontinent). The city is denser than most of Essex County, with a working-to-middle-class character shaped by its industrial past and its position as a more affordable alternative to Lawrence and Andover. Distinctive identity markers include a strong Hispanic commercial corridor along Broadway and a growing East/Southeast Asian presence in the newer subdivisions near the New Hampshire line.
How the city was settled and grew
Methuen was originally part of Haverhill, settled in the 1640s by English Puritan farmers seeking land along the Merrimack River. It was incorporated as a separate town in 1726, with the early population concentrated in the Methuen Center area around the Meeting House on the Common. The Spicket River’s water power drove the first industrial wave in the early 1800s, drawing Irish immigrants to work in the woolen and cotton mills that lined the river in what is now the Arlington Mills neighborhood. By the 1840s, French-Canadian families from Quebec began arriving, settling in the Pleasant Valley section near the Lawrence line, where they built St. Anne’s Church and established a tight-knit Catholic community that remained dominant through the mid-20th century. A smaller wave of Italian immigrants arrived around 1900, clustering in the Tenney Street area near the downtown rail depot. By 1950, Methuen was overwhelmingly White, with French-Canadian surnames still common on the city council rolls.
Modern era (post-1965)
The 1965 Hart-Cellar Act and the subsequent collapse of the city’s shoe and textile industries reshaped Methuen’s population. Puerto Rican families began arriving in the 1970s, drawn by factory work that was still available in Lawrence and by the cheaper housing stock in Methuen’s older neighborhoods. They concentrated in the East Methuen district, particularly along Broadway and Haverhill Street, where bodegas and Spanish-language churches now anchor the commercial life. Dominican and Guatemalan immigrants followed in the 1990s and 2000s, expanding the Hispanic population from 8% in 1990 to 32.8% today. The West Methuen area, closer to the Andover line, remained predominantly White and more affluent, with single-family homes and lower density. A smaller but notable East/Southeast Asian community—primarily Vietnamese and Chinese—began forming in the 2000s, settling in the newer subdivisions off Pelham Street near the New Hampshire border, drawn by the school system and proximity to Asian grocery networks in Lowell and Nashua. The Indian subcontinent population (1.8%) is more dispersed, with many households in the professional-class neighborhoods near the I-93 corridor.
The future
Methuen’s population is trending toward a stable tripartite structure: a shrinking White cohort (down from 80% in 1990), a plateauing Hispanic share that may reach 38-40% by 2035, and slow growth among East/Southeast Asian and Indian households. The city is not homogenizing—neighborhoods remain distinct, with East Methuen solidifying as the Hispanic core and West Methuen retaining its White-majority character. The 8.9% foreign-born share is below the state average (17.3%), suggesting that second-generation assimilation is outpacing new immigration. The college-educated share (30.5%) is rising slowly as professionals priced out of Andover and North Andover move into Methuen’s newer developments. The next decade will likely see continued infill development along the I-93 corridor, with the population edging toward 58,000 by 2040, but the ethnic geography will remain largely unchanged unless zoning changes allow denser housing in West Methuen.
For a conservative-leaning mover, Methuen offers a mixed picture: a city where traditional New England community structures persist in the western neighborhoods, while the eastern side is increasingly Hispanic and younger. The school system is under pressure from the demographic shift, but property taxes remain moderate relative to neighboring towns. The city is becoming more diverse without becoming unstable—a pragmatic choice for families who want suburban space and access to Boston without the premium prices of Andover or the urban challenges of Lawrence.
* Values derived from national, state, county, city and local statistics and may differ in a specific area. Last updated: 2026-04-23T05:06:20.000Z
Narrative content on this page is AI-generated and may contain mistakes. Verify any details that matter before acting on them.
ReloMaps may earn a commission from affiliate links at no extra cost to you.