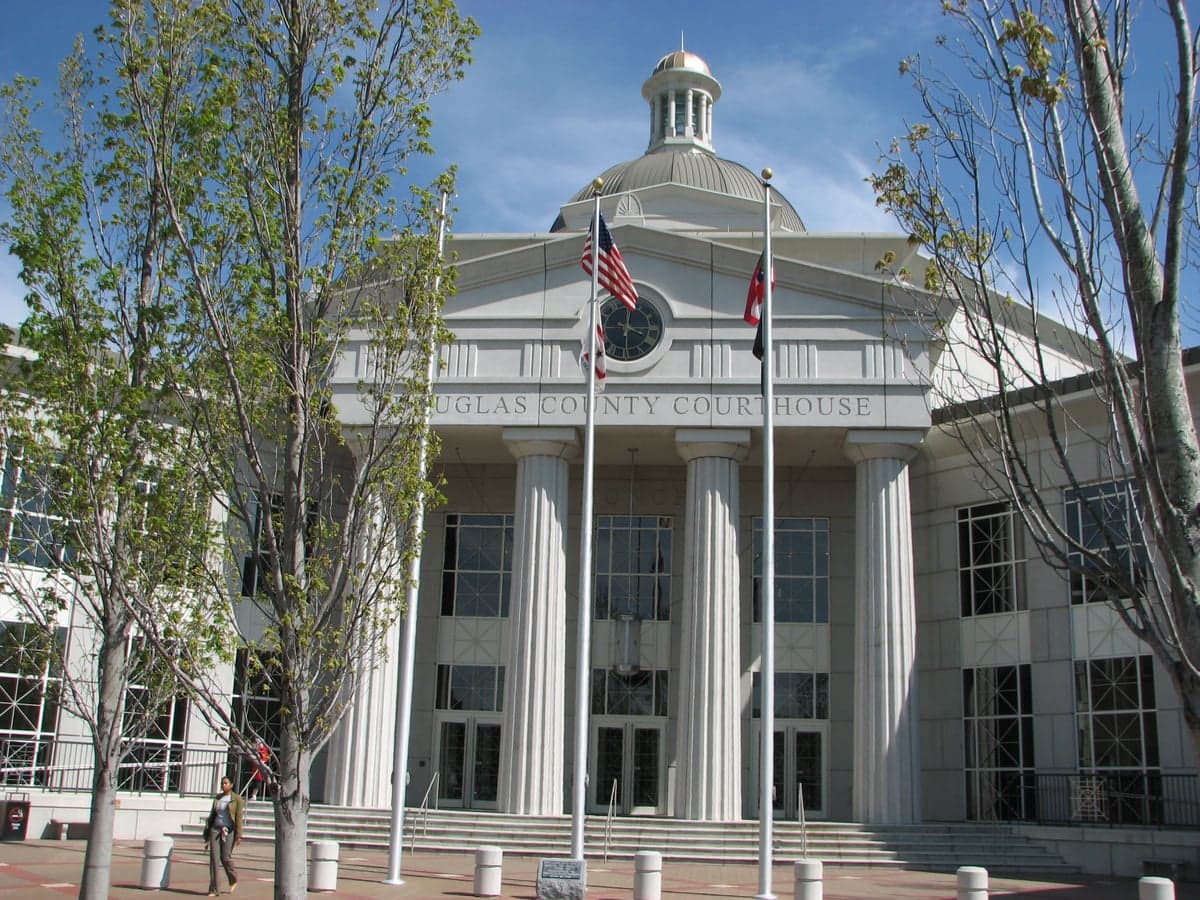
Photo: Wikipedia
Demographics of Douglas County
Affluence Level in Douglas County
A middle-class area roughly in line with national averages across income, home values, education, and employment.
People of Douglas County
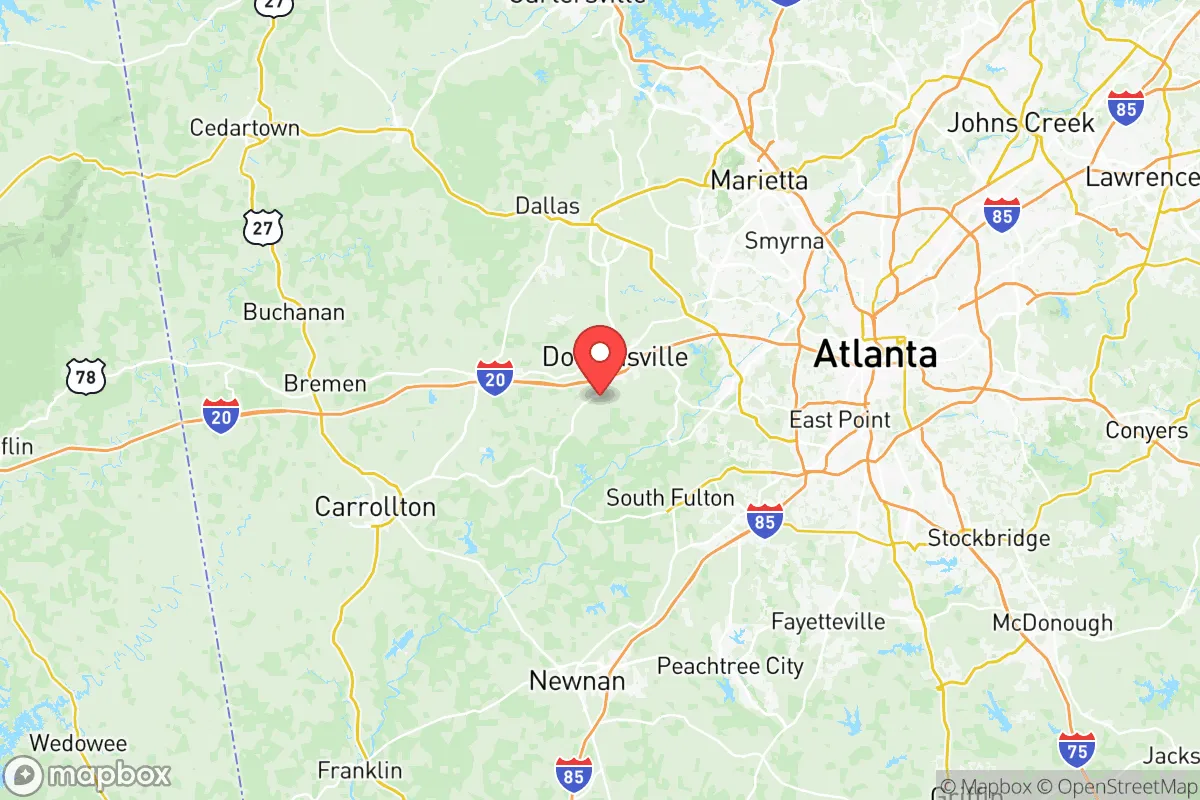
Today, Douglas County is a majority-Black, outer-ring Atlanta suburb where long-time rural roots meet rapid suburban expansion. With 48.5% of the population identifying as Black or African American, 32.8% as white, and 11.7% as Hispanic, the county has become one of the most racially diverse areas in the metro region. Its 146,141 residents are concentrated around the county seat of Douglasville, with smaller clusters in Lithia Springs, Villa Rica, and Winston, giving the county a character that blends small-town identity with commuter-oriented growth.
Settlement & growth (pre-1960)
Douglas County was carved from Campbell County in 1870, long after the original inhabitants—the Creek and Cherokee peoples—had been forcibly removed along the Trail of Tears in the 1830s. The first European-American settlers were predominantly Scots-Irish and English farmers who arrived in the early 1800s, lured by the fertile Piedmont soils and abundant timber. They established small crossroads communities such as Dice and Bremen (now partly in Haralson County), but the county’s true growth began with the railroad.
The Georgia Western Railroad reached the area in the 1870s, and Douglasville was founded in 1875 as a station town. For the next 80 years, the economy hinged on cotton farming, timber, and a handful of textile mills. The 1920 census counted fewer than 8,000 residents, most of them white farm families. African Americans, both freedmen and their descendants, lived in rural settlements like Lee’s Mills (later within Lithia Springs) and along the Chattahoochee River bottoms, working as sharecroppers and tenant farmers. No significant immigrant groups arrived during this period; the county remained nearly entirely native-born white and Black.
The Great Depression and boll weevil infestation devastated cotton agriculture, pushing many Black families northward during the Great Migration. By 1950 the population had only climbed to about 12,000. The opening of Interstate 20 in the 1960s changed everything, but that future belonged to the post-1965 era.
Modern era (post-1965)
The 1965 Hart-Cellar Act had a muted direct effect in Douglas County because the foreign-born share remains low at just 4.3%—the lowest among Atlanta’s suburban counties. Instead, the county’s modern demographic reshuffling came from domestic migration: African Americans moving from the city of Atlanta to the suburbs in search of larger homes and better schools, and white households who left the city decades earlier continuing to move further out. In the 1990s and 2000s, Douglasville and Lithia Springs saw explosive growth as subdivisions replaced hayfields. The county’s Black population rose from about 16% in 1980 to nearly half by 2020, a shift driven by both Black in-migration and white flight to more distant exurbs like Villa Rica, where the white share remains higher.
Hispanic growth began in the 1990s as construction and service jobs drew immigrants from Mexico and Central America. Today’s 11.7% Hispanic share is concentrated in Douglasville’s southern side and in mobile-home communities near Winston. While East/Southeast Asian and Indian communities each account for only 0.9% of the population, small professional enclaves have formed in newer subdivisions near the Westridge area of Douglasville, anchored by doctors and engineers working in Atlanta’s medical and tech sectors.
The county’s racial identity has shifted sharply: it is now the only metro Atlanta county that has flipped from white-majority to Black-majority since 2000, while also absorbing a modest Hispanic minority. The white population has fallen in absolute numbers, a trend common to inner-ring Black suburbs nationally. Politically, the county moved from reliably Republican in the 1990s to solidly Democratic by 2016, though its voter behavior is more moderate than Fulton or DeKalb counties.
The future
Douglas County’s population will likely continue to diversify, but without a large foreign-born base, most future growth will come from domestic migration—especially Black families seeking affordable homeownership and Hispanic families drawn by lower housing costs than Atlanta proper. The Hispanic share could reach 15–18% by 2035 if current trends hold, while the white share will probably stabilize near 30% as some young white professionals return for the county’s lower prices. The East/Southeast Asian and Indian communities are too small to project significant enclave formation unless a major employer relocates to the area, which currently shows no signs of happening.
The county is not tribalizing into ethnic islands as sharply as other Atlanta suburbs; instead, most neighborhoods are moderately integrated along income lines. Douglasville remains the commercial and civic core, while Lithia Springs holds a denser, older stock of housing. Villa Rica is trending whiter and more affluent, partly due to new school construction. The cultural identity of the county is slowly absorbing Hispanic and Black suburban middle-class norms—church-centered, family-oriented, with strong ties to Atlanta sports and entertainment.
For someone moving into Douglas County now, the place is becoming a majority-Black, family-focused outer suburb with a growing Hispanic flavor, low crime compared to the inner Southside, and a housing stock that is newer than Clayton County but older than Paulding. The 30.8% college education rate trails the metro average but reflects a workforce that values practical degrees and trade skills. The county’s political lean will remain Democratic, but its social conservatism on issues like school choice and property taxes still appeals to many residents across all racial groups.
* Values derived from national, state, county, city and local statistics and may differ in a specific area. Last updated: 2026-06-06T00:27:15.000Z
Narrative content on this page is AI-generated and may contain mistakes. Verify any details that matter before acting on them.
ReloMaps may earn a commission from affiliate links at no extra cost to you.