
Photo: Wikipedia
Demographics of Fruitland, MD
Affluence Level in Fruitland, MD
A middle-class area roughly in line with national averages across income, home values, education, and employment.
People of Fruitland, MD
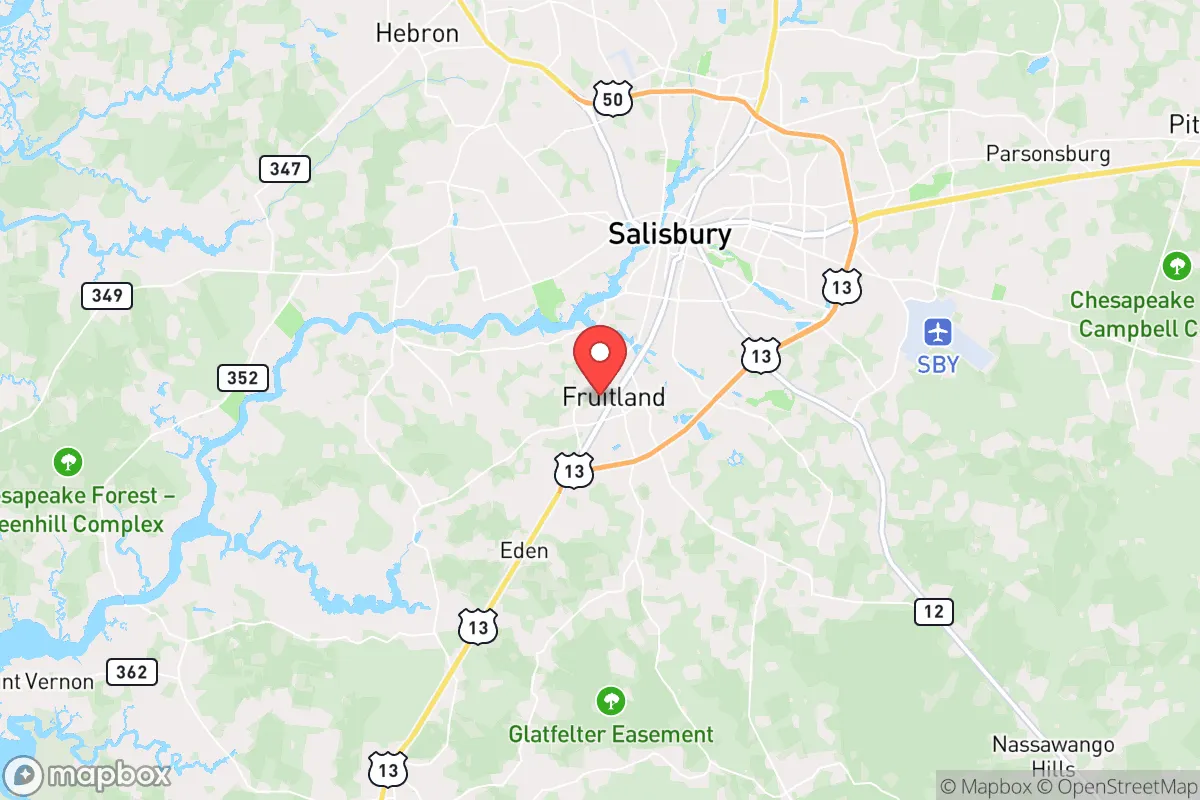
Fruitland, Maryland, is a small, family-oriented city of 5,698 residents where a white-plurality population (51.1%) coexists with a substantial Black community (26.9%) and a growing Hispanic presence (13.8%). The city’s character is shaped by its roots as a railroad and agricultural hub on Maryland’s Eastern Shore, now transitioning into a bedroom community for Salisbury and the broader Delmarva Peninsula. With a relatively high college-educated rate of 39.7% and a low foreign-born share of just 4.2%, Fruitland’s population is predominantly native-born, stable, and increasingly diverse in its racial and ethnic makeup.
How the city was settled and grew
Fruitland’s human history begins in the late 19th century, when the Wicomico County area was primarily agricultural, with small farms and timber operations. The city’s name itself hints at its early economy: fruit orchards and vegetable farming were the mainstays. The arrival of the railroad in the 1870s—specifically the Wicomico and Pocomoke Railroad—transformed the area from a rural crossroads into a shipping point for produce. The original settlers were largely white farmers of English and German descent, who established homesteads along what is now Main Street and the surrounding rural lanes. The historic Downtown Fruitland district, centered around the railroad depot, became the commercial and social heart, with general stores and churches serving the farming community. A small Black population, descended from freedmen and their families, settled in the South Fruitland area, near the railroad tracks, where they worked as laborers and domestic workers on the surrounding farms. This pattern of racial separation—white families in the north and center, Black families in the south—persisted well into the mid-20th century.
Modern era (post-1965)
After the 1965 Hart-Cellar Act, Fruitland saw little direct immigration—its foreign-born share remains low at 4.2%—but the city experienced significant domestic in-migration. The completion of U.S. Route 13 and the expansion of Salisbury’s economy (home to Salisbury University and Peninsula Regional Medical Center) drew new residents seeking affordable housing and shorter commutes. During the 1970s and 1980s, West Fruitland (near the Salisbury border) saw the construction of suburban-style subdivisions, attracting white middle-class families from Salisbury and the surrounding rural areas. Meanwhile, the Black population, which had historically been concentrated in South Fruitland, began to spread into East Fruitland (along Old Ocean City Road) as housing discrimination eased. The Hispanic population, now 13.8% of the city, began arriving in the 1990s and 2000s, primarily from Central America (El Salvador and Guatemala), drawn by work in poultry processing plants in nearby towns like Princess Anne and Hebron. These families initially settled in North Fruitland, near the industrial park, where rental housing was more available. The East/Southeast Asian community (3.1%) is a smaller, more recent addition, largely comprising Vietnamese and Filipino families who moved to the area for jobs in healthcare and manufacturing; they are scattered across the city, with no single ethnic enclave. The Indian-subcontinent population (0.3%) is negligible, consisting of a handful of professionals working at Salisbury University or the medical center.
The future
Fruitland’s population is trending toward greater racial and ethnic diversity, but the pace is slow. The white share (51.1%) is declining gradually as older residents age and younger families move in, while the Hispanic share is the fastest-growing segment, projected to reach 18-20% by 2035 if current trends hold. The Black population (26.9%) is stable, with families rooted in the area for generations. The city is not tribalizing into distinct enclaves; rather, new subdivisions like Fruitland Crossing (built in the 2010s) are attracting a mix of white, Black, and Hispanic homebuyers, suggesting a slow but real integration. The foreign-born share is likely to rise modestly as Hispanic families continue to settle, but Fruitland will remain a predominantly native-born city. The biggest demographic shift may be generational: as the college-educated cohort (39.7%) grows, the city’s political and cultural character may become more moderate and suburban, moving away from its rural, conservative roots.
For someone moving to Fruitland now, the city offers a stable, family-oriented environment with a modest but real diversity. The white-plurality majority is shrinking, the Hispanic community is growing, and the Black population remains a significant presence. The city is becoming more integrated and suburban, but it retains a small-town feel where neighborhoods are defined more by income and housing stock than by race. It is a place where a newcomer can find a quiet, affordable home and a community that is slowly, steadily changing.
* Values derived from national, state, county, city and local statistics and may differ in a specific area. Last updated: 2026-04-22T01:44:57.000Z
Narrative content on this page is AI-generated and may contain mistakes. Verify any details that matter before acting on them.
ReloMaps may earn a commission from affiliate links at no extra cost to you.