Paradise Valley, AZ vs Phoenix, AZ
Side-by-side comparison · Updated Jun 2026

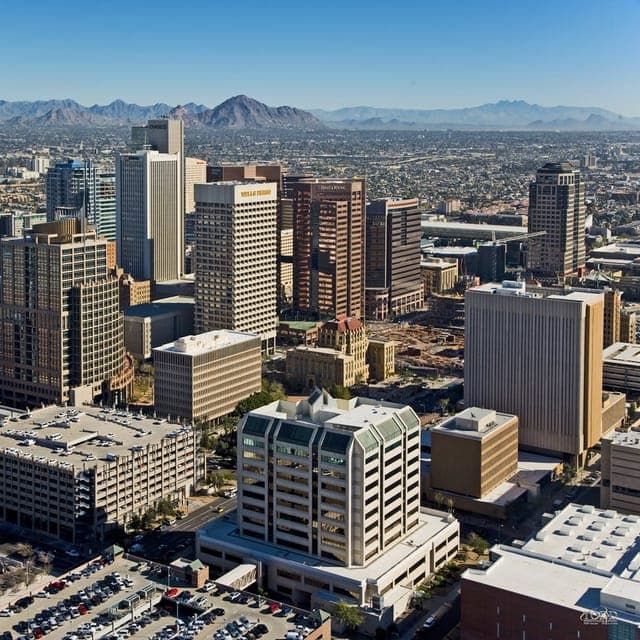
Report card
| Category | Paradise ValleyParadise Valley, AZ | PhoenixPhoenix, AZ | Same grade |
|---|---|---|---|
| ReloScoreOverall grade | |||
| Affluence | Elite | Average | |
| Cost of Living | |||
| Crime | Very Safe | Elevated | |
| Education | |||
| Quality of Life | Good | Great | |
| Sovereignty | Self-Reliant | Self-Reliant | Same |
| Strategic | Vulnerable | Vulnerable | Same |
Grades rate each place against all US places. How grades work →
Comparison summary

At 72 violent crimes per 100,000 people, Paradise Valley, AZ and Phoenix, AZ show a stark contrast, with Phoenix reporting 694 per 100,000, a 9.6× higher rate according to 2025 FBI data. Property crime per 100,000 also differs sharply: Paradise Valley's 561 compares to Phoenix's 2,036, placing Paradise Valley in the 13th percentile and Phoenix in the 78th. These 2023 Census figures also reveal a wide gap in median age, with Paradise Valley at 55.5 years (96th percentile) versus Phoenix at 34.8 (24th percentile), a 20.7-year difference.
Population size diverges dramatically: Paradise Valley's 12,621 residents (35th percentile) are dwarfed by Phoenix's 1,624,832 (100th percentile). Population density follows suit, with Phoenix at 3,134 people per square mile (79th percentile) compared to Paradise Valley's 821 (21st percentile). The poverty rate in Phoenix is 14.3% (63rd percentile), 9.3 percentage points higher than Paradise Valley's 5.0% (13th percentile). Educational attainment also differs: 72.9% of adults in Paradise Valley hold a bachelor's degree or higher (96th percentile), while Phoenix's rate is 32.3% (50th percentile), a 40.6-point gap.
Both cities share an unemployment rate of 3.2% and identical job growth of +2.1% year-over-year. The cost of living index stands at 464 for Paradise Valley (99th percentile) versus 129 for Phoenix (67th percentile), with Paradise Valley's median home value of $2,000,001 far exceeding Phoenix's $381,900. Median household income in Paradise Valley is $236,250 (99th percentile) compared to Phoenix's $77,041 (55th percentile). The two cities have the same air quality index of 77 (98th percentile) and identical grades for climate comfort, healthcare access, and national disaster risk.
AI-generated and may contain mistakes. Verify any details that matter before acting on them. Generated Oct 2026.
Looking at homes in Paradise Valley or Phoenix?
Get a property report for a specific address.
Free account required. Your first report is free.
Where they differ most
Cost of living
| Metric | Paradise Valley, AZ | Phoenix, AZ | Difference |
|---|---|---|---|
| COL indexCost of living index (100 = US) | 46499th pctl | 12967th pctl | Cost of living index (100 = US): Paradise Valley, AZ 464; Phoenix, AZ 129; Paradise Valley is 3.6 times higher. |
| Home valueMedian home value | $2,000,00199th pctl | $381,90069th pctl | Median home value: Paradise Valley, AZ $2,000,001; Phoenix, AZ $381,900; Paradise Valley is 5.2 times higher. |
| Median rent | $3,501100th pctl | $1,45868th pctl | Median rent: Paradise Valley, AZ $3,501; Phoenix, AZ $1,458; Paradise Valley is 2.4 times higher. |
| Household incomeMedian household income | $236,25099th pctl | $77,04155th pctl | Median household income: Paradise Valley, AZ $236,250; Phoenix, AZ $77,041; Paradise Valley is 3.1 times higher. |
| Comfortable (single)Comfortable income (single) | $388,56599th pctl | $74,19770th pctl | Comfortable income (single): Paradise Valley, AZ $388,565; Phoenix, AZ $74,197; Paradise Valley is 5.2 times higher. |
| Comfortable (family)Comfortable income (family of 4) | $571,19099th pctl | $109,06970th pctl | Comfortable income (family of 4): Paradise Valley, AZ $571,190; Phoenix, AZ $109,069; Paradise Valley is 5.2 times higher. |
| AffordabilityHousing affordability | Unaffordable | Stretched | Housing affordability: Paradise Valley, AZ D-; Phoenix, AZ B-; Phoenix is graded higher. |
Housing-adjusted salary
the same housing budget in Phoenix needs about
$20,900
Based only on local housing costs and incomes (cost-of-living index 464 vs 129). Leaves out taxes, groceries and transport. How it works →
Data: U.S. Census ACS 5-year, ReloMaps cost-of-living index (2023–2024).
Jobs & income
| Metric | Paradise Valley, AZ | Phoenix, AZ | Difference |
|---|---|---|---|
| Unemployment | 3.2%29th pctl | 3.2%29th pctl | About the same |
| Job growthJob growth (YoY) | +2.1%78th pctl | +2.1%78th pctl | About the same |
| Per-capita income | $149,31899th pctl | $40,30958th pctl | Per-capita income: Paradise Valley, AZ $149,318; Phoenix, AZ $40,309; Paradise Valley is 3.7 times higher. |
| Poverty rate | 5.0%13th pctl | 14.3%63rd pctl | Poverty rate: Paradise Valley, AZ 5.0%; Phoenix, AZ 14.3%; Phoenix is 9.3 points higher. |
| CommuteAverage commute | 22 min40th pctl | 25.7 min65th pctl | Average commute: Paradise Valley, AZ 22 min; Phoenix, AZ 25.7 min; Phoenix is 4 minutes longer. |
| Work from home | 25.8%92nd pctl | 16.9%76th pctl | Work from home: Paradise Valley, AZ 25.8%; Phoenix, AZ 16.9%; Paradise Valley is 8.9 points higher. |
| OpportunityEconomic opportunity | Strong | Stable | Economic opportunity: Paradise Valley, AZ A+; Phoenix, AZ C; Paradise Valley is graded higher. |
| Job market | Strong | Strong | About the same |
Data: U.S. Census ACS 5-year, BLS (2023).
Safety
| Metric | Paradise Valley, AZ | Phoenix, AZ | Difference |
|---|---|---|---|
| Violent crimeViolent crime per 100k | 7214th pctl | 69493rd pctl | Violent crime per 100k: Paradise Valley, AZ 72; Phoenix, AZ 694; Phoenix is 9.6 times higher. |
| Property crimeProperty crime per 100k | 56113th pctl | 2,03678th pctl | Property crime per 100k: Paradise Valley, AZ 561; Phoenix, AZ 2,036; Phoenix is 3.6 times higher. |
| 5-yr trendViolent crime, 5-yr trend | Rising | Rising | |
| Crime & safety | Very Safe | Dangerous | Crime & safety: Paradise Valley, AZ A+; Phoenix, AZ D; Paradise Valley is graded higher. |
| Traffic safety | SafeCounty figure. County-level figure: measured for the surrounding county. | SafeCounty figure. County-level figure: measured for the surrounding county. | About the same |
Data: FBI Crime Data, NHTSA FARS (2025).
Quality of life
| Metric | Paradise Valley, AZ | Phoenix, AZ | Difference |
|---|---|---|---|
| Air quality | ModerateCounty figure. County-level figure: measured for the surrounding county. | ModerateCounty figure. County-level figure: measured for the surrounding county. | About the same |
| ClimateClimate comfort | Dry | Dry | About the same |
| HealthcareHealthcare access | ExcellentCounty figure. County-level figure: measured for the surrounding county. | ExcellentCounty figure. County-level figure: measured for the surrounding county. | About the same |
| Tap water | Fair | Fair | About the same |
| Power grid | ReliableState figure. State-level figure: the local figure isn't published. | ReliableState figure. State-level figure: the local figure isn't published. | About the same |
| HomesteadingHomesteading potential | Prime | Prime | About the same |
| Disaster riskNational disaster risk | High-Risk | High-Risk | About the same |
3 rows not shown: broadband, walkability and local food access aren't available for either place.
Data: EPA AirData, NOAA NCEI, County Health Rankings, FCC, Geoapify POIs, EPA SDWIS, EIA, OpenStreetMap, FEMA National Risk Index (2022–2024).
Taxes & laws
Both are in Arizona, so state taxes and state laws (homeschooling, firearms, property rights) are the same. See Arizona →
Strategic location
How exposed each place is to large-scale disruption, based on distance from big cities, likely targets and natural hazards.
| Metric | Paradise Valley, AZ | Phoenix, AZ | Difference |
|---|---|---|---|
| Large cityNearest large city | 10 mi11th pctl | 9 mi9th pctl | Nearest large city: Paradise Valley, AZ 10 mi; Phoenix, AZ 9 mi; Paradise Valley is 10% higher. |
| Target proximity | Poor | Weak | Target proximity: Paradise Valley, AZ F; Phoenix, AZ C+; Phoenix is graded higher. |
| To borderDistance to international border | 114 mi12th pctl | 113 mi12th pctl | About the same |
| To coastDistance to coastline | 163 mi38th pctl | 163 mi38th pctl | About the same |
| StrategicStrategic location | Vulnerable | Vulnerable | About the same |
Data: ReloMaps strategic assessment.
People
| Metric | Paradise Valley, AZ | Phoenix, AZ | Difference |
|---|---|---|---|
| Population | 12,62135th pctl | 1,624,832100th pctl | Population: Paradise Valley, AZ 12,621; Phoenix, AZ 1,624,832; Phoenix is 1,612,211 larger. |
| DensityPopulation density (per sq mi) | 82121st pctl | 3,13479th pctl | Population density (per sq mi): Paradise Valley, AZ 821; Phoenix, AZ 3,134; Phoenix is 3.8 times higher. |
| Median age | 55.596th pctl | 34.824th pctl | Median age: Paradise Valley, AZ 55.5; Phoenix, AZ 34.8; Paradise Valley is 20.7 years older. |
| Bachelor's+Bachelor's degree or higher | 72.9%96th pctl | 32.3%50th pctl | Bachelor's degree or higher: Paradise Valley, AZ 72.9%; Phoenix, AZ 32.3%; Paradise Valley is 40.6 points higher. |
| Household sizeAverage household size | 2.561st pctl | 2.773rd pctl | Average household size: Paradise Valley, AZ 2.5; Phoenix, AZ 2.7; Phoenix is 5% larger. |
More about Paradise Valley's residents · Phoenix's residents
Data: U.S. Census ACS 5-year (2023).
Politics
Information only. Not part of any grade, difference or summary on this page.
| Measure | Paradise ValleyParadise Valley, AZ | PhoenixPhoenix, AZ |
|---|---|---|
| Cook PVI | R+1 | R+1 |
| 2024 presidential | R +3.1 pts | R +3.1 pts |
Full politics data: Paradise Valley · Phoenix
Moving between Paradise Valley and Phoenix
- Median rent: $3,501 in Paradise Valley, $1,458 in Phoenix
- Median home value: $2,000,001 in Paradise Valley, $381,900 in Phoenix
- Cost of living index (100 = US): 464 in Paradise Valley, 129 in Phoenix
- Median household income: $236,250 in Paradise Valley, $77,041 in Phoenix
- Comfortable income (family of 4): $571,190 in Paradise Valley, $109,069 in Phoenix
- Unemployment: 3.2% in Paradise Valley, 3.2% in Phoenix
- Average commute: 22 min in Paradise Valley, 25.7 min in Phoenix
- Violent crime per 100k: 72 in Paradise Valley, 694 in Phoenix
Weigh these by what matters to you
ReloMaps in ChatGPT can look at Paradise Valley and Phoenix against your own priorities, like budget, commute or climate.
Use ReloMaps in ChatGPT →Found a home in Paradise Valley or Phoenix?
A property report covers the address itself: the block, the neighbourhood data, risks and more, beyond these city-wide figures.
Free account required. Your first report is free.
Compare a different pair
People also compare


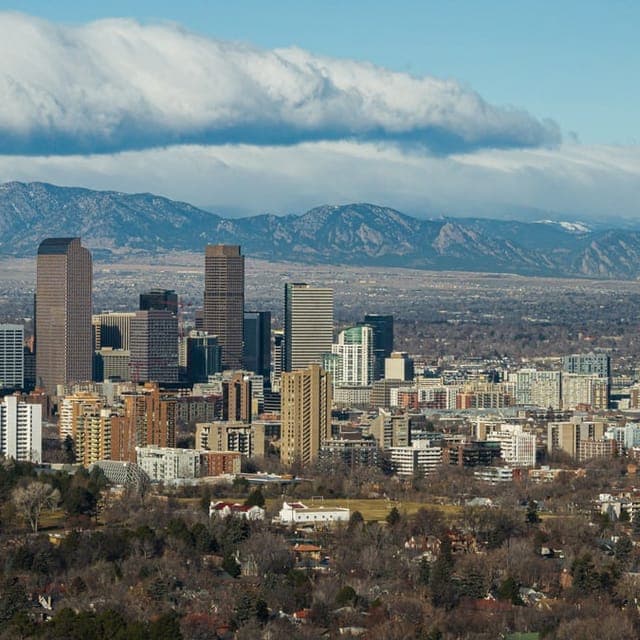
More places like Paradise Valley and Phoenix

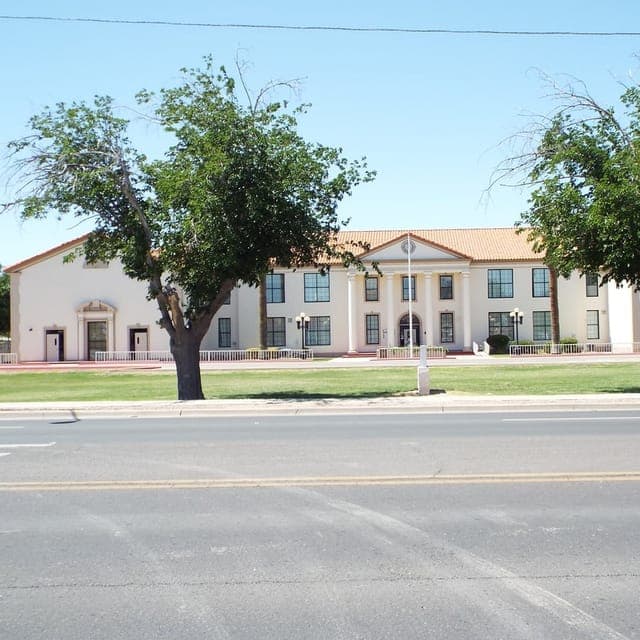

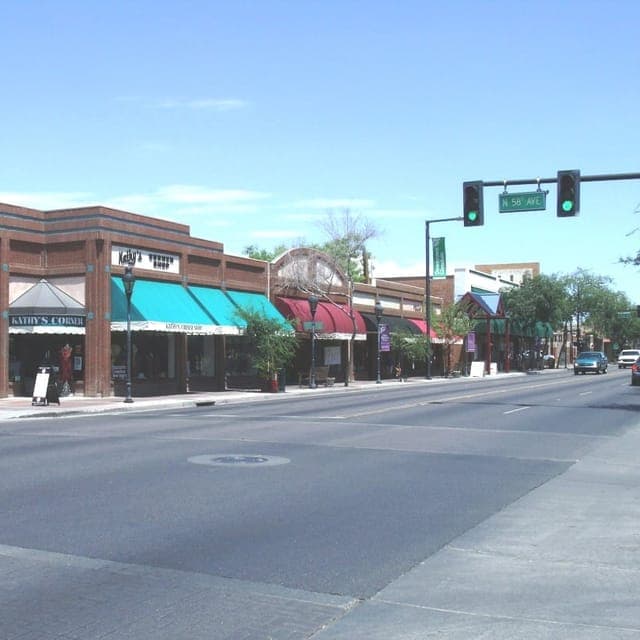

- Data: Cost of living: U.S. Census ACS 5-year, ReloMaps cost-of-living index (2023–2024).
- Data: Jobs & income: U.S. Census ACS 5-year, BLS (2023).
- Data: Safety: FBI Crime Data, NHTSA FARS (2025).
- Data: Quality of life: EPA AirData, NOAA NCEI, County Health Rankings, FCC, Geoapify POIs, EPA SDWIS, EIA, OpenStreetMap, FEMA National Risk Index (2022–2024).
- Data: Strategic location: ReloMaps strategic assessment.
- Data: People: U.S. Census ACS 5-year (2023).
* Values derived from national, state, county, city and local statistics and may differ in a specific area.
Narrative content on this page is AI-generated and may contain mistakes. Verify any details that matter before acting on them.
ReloMaps may earn a commission from affiliate links at no extra cost to you.