Types of Tax Burden Explained for U.S. Relocation

The six practical types of tax burden are income, property, sales and other consumption, payroll, excise, and regressive or less-visible taxes, but choosing the lowest income-tax rate won't necessarily minimize your household's costs. Your true burden depends on income, housing, employment, consumption, and location, not one headline rate.
These categories aren't mutually exclusive. Excise taxes are a form of consumption taxation, while regressive describes how a burden falls across income levels rather than a separate tax base. For relocation decisions, the useful question is which taxes your household encounters, how much income they absorb, and what you receive in return.
Table of Contents
- Why Tax Burden Is More Than an Income Tax Rate
- How to Measure the True Tax Burden
- Compare the Main Types of Tax Burden
- Reveal Hidden and Regressive Tax Costs
- See How Household Profiles Change the Result
- Build a State and Local Tax Comparison
- Use ReloMaps Indicators in Location Research
- Frequently Asked Questions
- How do I compare states when one taxes income and another relies on purchases?
- Can moving to a state without broad individual income tax create transition costs?
- Why might an employee owe tax despite having no state income-tax withholding?
- How should a buyer or renter investigate property-tax exposure at an address?
Why Tax Burden Is More Than an Income Tax Rate
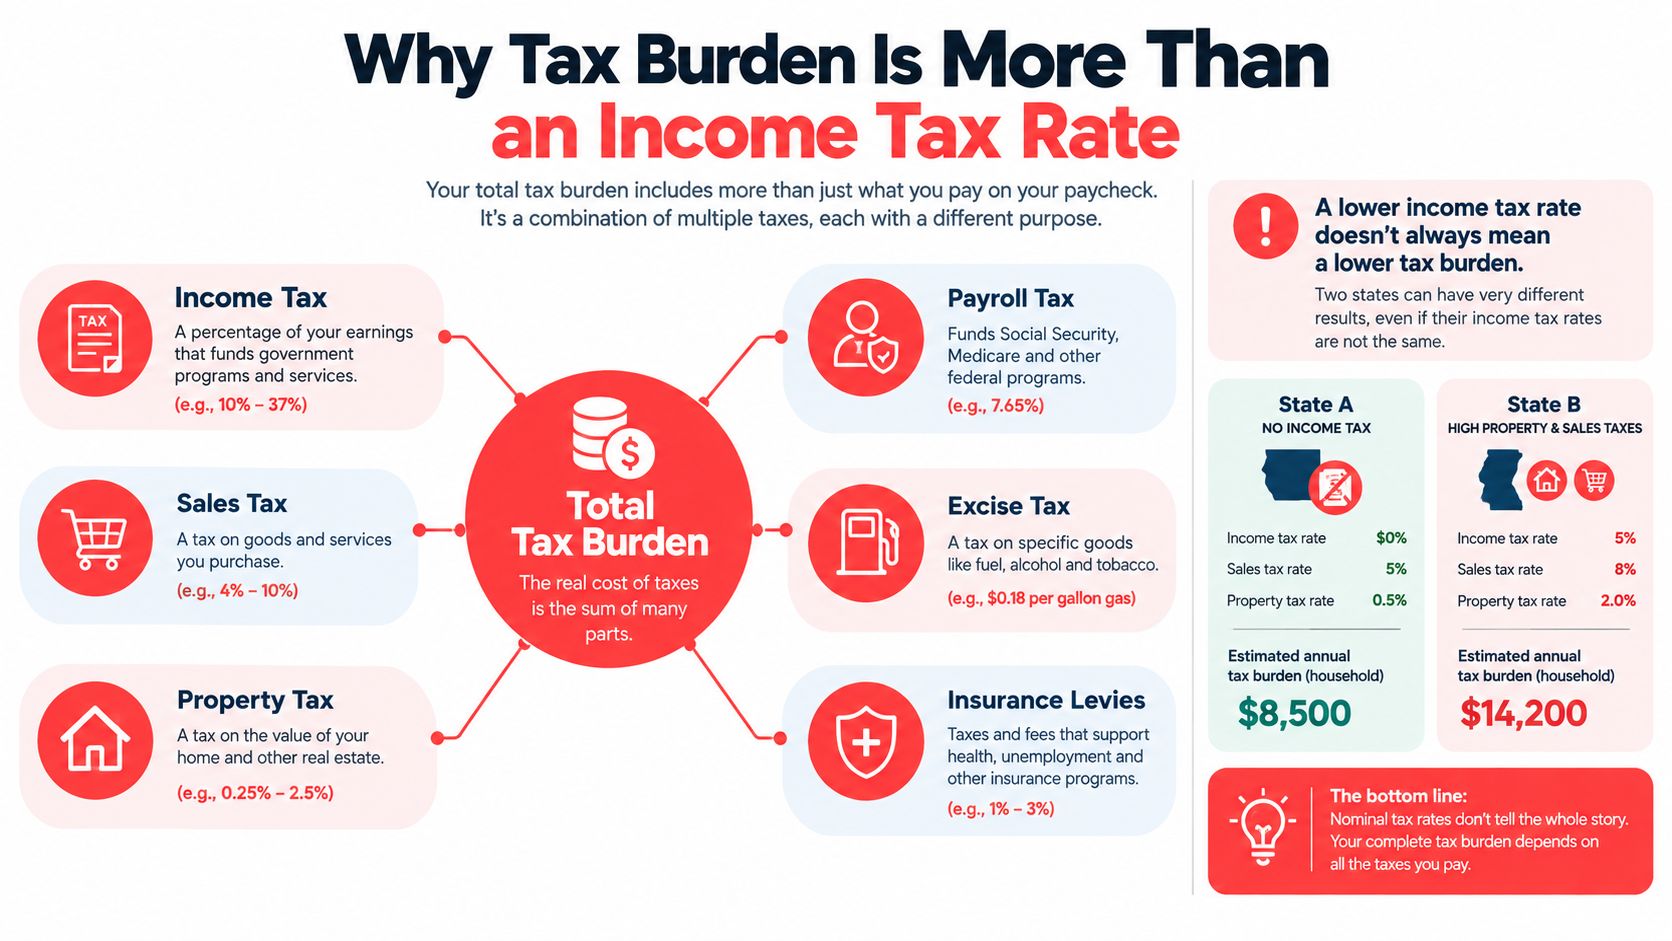
Moving to a state without a broad individual income tax doesn't eliminate exposure to property, sales, payroll, excise, insurance, vehicle, or utility taxes. A comparison based only on income-tax brackets leaves those household expenses outside the calculation.
The same destination can also produce different results for neighbors. An employee renting an apartment, a homeowner with substantial property value, and a retiree drawing investment income don't encounter the local tax mix in the same proportions.
The broader set of exposures is illustrated below.
What a broad tax measure can tell you
The tax-to-GDP ratio compares government tax revenue with economic output. It measures a country's aggregate fiscal burden, but it doesn't identify what a household pays or whether workers, consumers, homeowners, or businesses bear more of the cost, as explained in OECD Revenue Statistics.
That limitation matters when reading rankings. A population-wide measure can describe the surrounding tax environment without predicting your personal bill.
Practical rule: Use broad rankings to identify places worth investigating, not to calculate what you'll save by moving.
A useful relocation comparison starts with household exposure:
- Earnings: What income will you receive, and from which sources?
- Housing: Will you rent or own, and what property value are you considering?
- Spending: Which purchases will attract taxes?
- Offsets: Which exemptions, credits, benefits, or public services apply?
Those questions distinguish an affordable destination from a place with an appealing headline rate.
How to Measure the True Tax Burden
Statutory liability identifies the party legally responsible for a tax. Legal incidence describes that formal payment obligation, while economic incidence asks who ultimately absorbs the cost.
A business can remit a tax without bearing its entire economic cost. Consumers may pay higher prices, employees may receive lower wages, or shareholders may earn lower returns. The Tax Foundation's state-local tax-burden methodology uses incidence assumptions and reallocates some payments across state borders rather than treating collections as identical to residents' burdens.
Keep the denominator consistent
Different measurements answer different questions. A revenue-to-output ratio describes an economy; a household effective rate describes taxes relative to a specified income measure.
The tax wedge uses another denominator: total employer labor cost. For a single worker without children earning the average national wage, the OECD average wedge was 34.9% in 2024, including personal income tax and employee and employer social-security contributions, less cash benefits, according to OECD Taxing Wages.
That isn't a withholding rate or marginal bracket. You can't apply it directly to a U.S. job offer or compare it with a percentage calculated against gross wages.
For household research, distinguish:
- Gross tax burden: Taxes attributed to the household before relevant benefits.
- Effective tax rate: That burden divided by a clearly defined income measure.
- Net fiscal burden: Taxes minus relevant cash and in-kind benefits.
- Marginal rate: The rate applicable to additional taxable income, not the average share paid.
Use a measurement hierarchy
Identify the tax base before choosing a rate. Then determine who remits the payment, assess whether any economic cost reaches your household indirectly, and estimate your direct exposure using applicable rules.
Only afterward should you incorporate transfers and services. Keep cash benefits separate from services you value but can't spend on bills, and label uncertain incidence estimates rather than presenting them as exact household liabilities.
Compare the Main Types of Tax Burden
Tax rates become meaningful only when attached to a tax base. A percentage of taxable earnings isn't comparable to a percentage of assessed property value or taxable purchases.
The OECD's revenue classification illustrates how differently governments rely on those bases. In 2023, consumption taxes represented 31.2% of OECD tax revenue and property taxes 5.1%; income taxes were the largest source in 20 countries, social-security contributions in 10, and goods-and-services taxes in eight.
These are shares of government revenue, not percentages of household income. Their practical value is showing why a location's tax mix deserves examination beyond its income-tax schedule.
Comparing the Main Types of Tax Burden
| Tax Type | What Triggers It | When It Appears | Who Remits It | Potential Economic Bearer | Key Household Variables |
|---|---|---|---|---|---|
| Income | Taxable earnings or investment income | Withholding and filing or payment cycles | Individual or withholding employer | Income recipient | Income source, deductions, filing circumstances |
| Property | Taxable real estate or other property | Recurring assessment and billing cycles | Property owner | Owner; potentially occupants through housing costs | Taxable value, exemptions, ownership |
| Sales and general consumption | Taxable purchases | At purchase | Seller under applicable collection rules | Consumer; potentially seller | Spending mix, taxable items, purchase location |
| Payroll | Employment earnings | Payroll cycles | Employer for relevant contributions | Worker and employer through labor-market effects | Wage level, employment arrangement, benefits |
| Excise | Selected goods or activities | Purchase or embedded in price | Designated seller or producer | Purchaser or business owner | Consumption of taxed goods and activities |
| Business-related | Taxable business income, property, or activity | Applicable business payment cycles | Business | Workers, consumers, investors | Business ownership and indirect exposure |
Compare exposure, not isolated percentages
For an employee, income and payroll calculations begin with compensation and household circumstances. For a property buyer, the relevant starting point is the property's taxable assessment under the applicable rules, not its advertised price.
Consumption taxes require a spending model. Applying a sales-tax rate to all household spending can overstate exposure if some purchases aren't taxable, while ignoring selected excises can understate it.
Business-related taxes require more caution. They're a cross-cutting category because their possible household effects don't necessarily arrive as a separately identified payment. You shouldn't assign an arbitrary share of every local business tax to yourself.
Never add tax rates that apply to different bases. Convert each direct exposure into an estimated annual amount first.
For a usable comparison, retain the base, rate, exemption assumptions, and payment period alongside each estimate. That audit trail makes it possible to distinguish a genuine difference between destinations from a difference in how you calculated them.
Reveal Hidden and Regressive Tax Costs
A household budget can contain tax costs that don't appear under a line labeled “tax.” Insurance levies, utility taxes, vehicle-related charges, and taxes embedded in business prices deserve investigation alongside the amounts shown on tax returns.
The following illustration identifies categories to check. It shouldn't be treated as a quantified bill for a representative household.
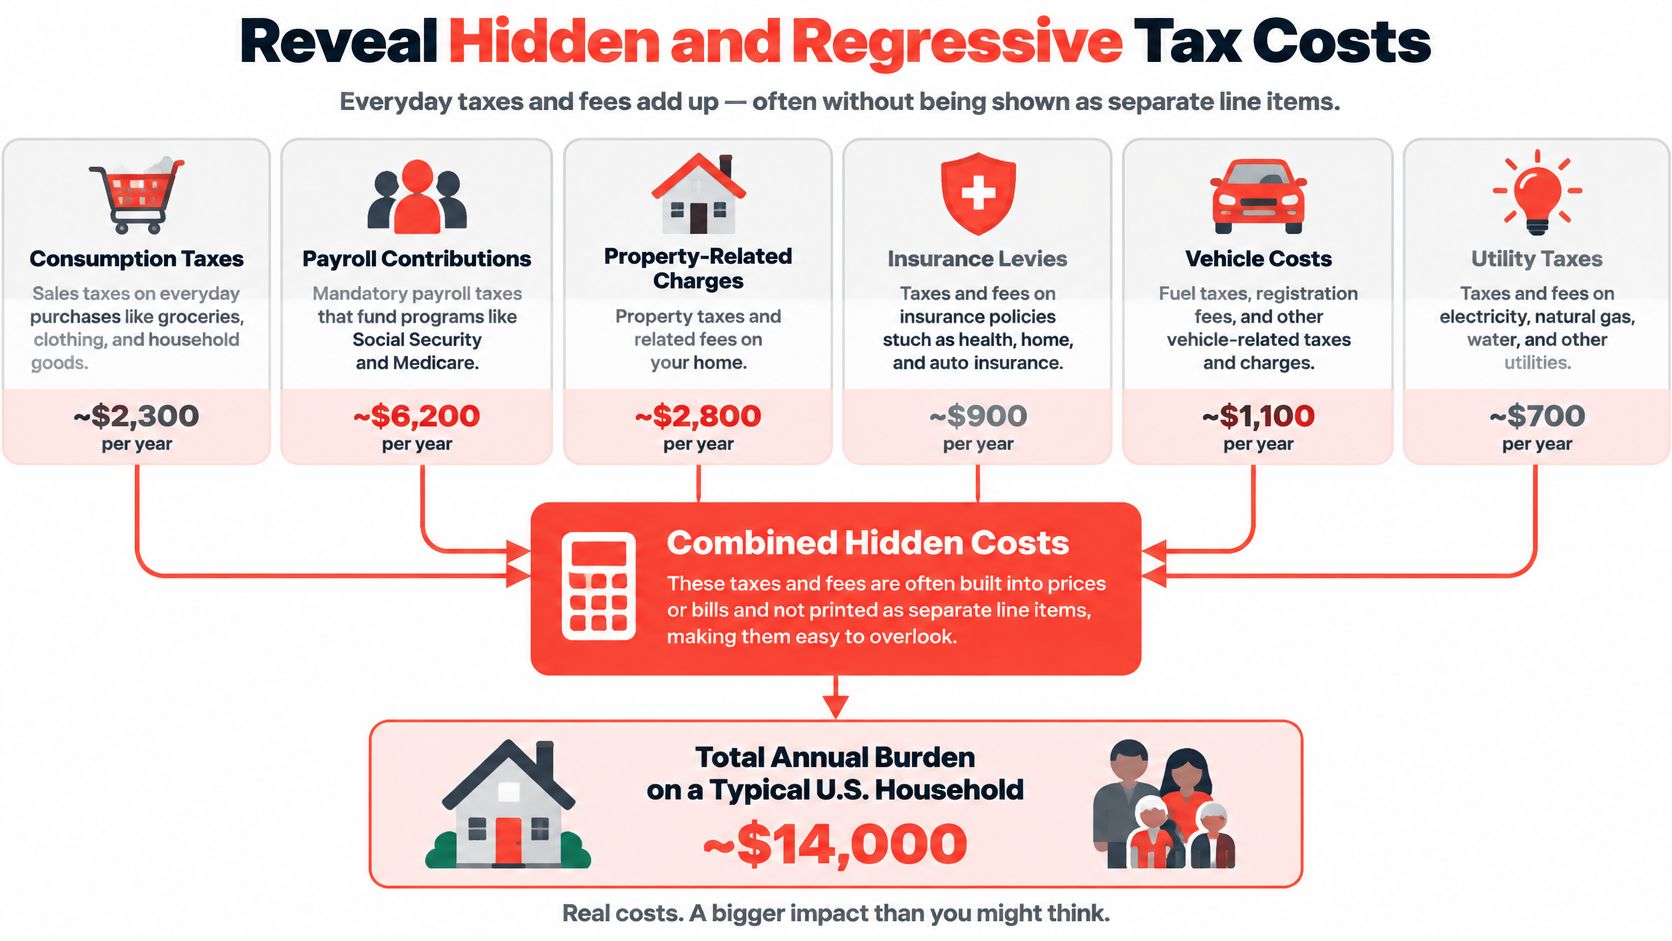
Trace the shopping basket
Consumption taxes are generally regressive relative to income because lower-income households spend more of their earnings on consumption. A shopping basket can therefore absorb a larger income share even when the applicable tax rate doesn't change.
Local property exposure also deserves attention: property taxes generate about 70% of local tax revenue nationwide and more than 80% in 18 states, according to the National Taxpayers Foundation property-tax report. Those figures describe local revenue dependence, not the proportion of an individual's budget spent on property tax.
To investigate your own less-visible costs:
- Separate taxes from other charges: Don't automatically classify every insurance premium, utility charge, or vehicle expense as taxation.
- Inspect ordinary transactions: Review likely purchases, housing payments, employment deductions, and recurring bills.
- Mark uncertain pass-through: Treat embedded business costs as possible exposure, not a precisely known personal liability.
- Check offsets: Record applicable deductions, exemptions, credits, and benefits beside the relevant expense.
Employer-side contributions deserve a similar check. Their absence from an employee's visible deductions doesn't establish that they have no economic effect, but it also doesn't justify adding the entire employer payment to a personal cash-flow budget.
The accompanying video offers another format for considering the topic.
The analytical distinction is between cash you directly pay, costs already embedded in your budget, and estimated economic effects. Keeping those separate prevents double-counting.
See How Household Profiles Change the Result
Consider hypothetical movers evaluating the same destination. A salaried renter begins with compensation, payroll deductions, rent, and taxable spending, while a homeowner must also investigate the property's assessment and available exemptions.
A family's relevant inputs include household composition and purchasing needs. A retiree needs a breakdown of income sources rather than a comparison built around an employee's paycheck. These aren't predictions of specific savings; they're different starting points for the calculation.
Build a reusable household record
Use the same household assumptions across every candidate city:
- Income composition: Employment earnings, business income, investment returns, and retirement income.
- Housing position: Renter or owner, expected housing cost, and prospective property value.
- Household circumstances: Family composition and potentially relevant benefit eligibility.
- Consumption pattern: Expected taxable purchases and selected excise exposure.
- Work arrangement: Employee, business owner, remote worker, or retiree.
For buyers, pair tax research with a cash-flow stress test for homebuyers from The Money Maniac. Use it to test payment affordability rather than treating a favorable tax ranking as proof that a home fits your budget.
Separate affordability from distributional evidence
In one U.S. distributional framework, effective fiscal incidence rates including transfers were estimated at 10.1% for the lowest income quintile, 22.4% for the middle quintile, and 41.4% for the highest quintile, according to the Tax Foundation's federal, state, and local analysis.
Those estimates aren't destination-specific quotations for your household. Their value is demonstrating why income position and transfers belong in an effective-burden comparison.
A shortlist of affordable U.S. cities can start the search, but your household record should determine which candidates survive. Keep that record stable while comparing locations, then run separate scenarios for changes such as buying a home or retiring.
Build a State and Local Tax Comparison
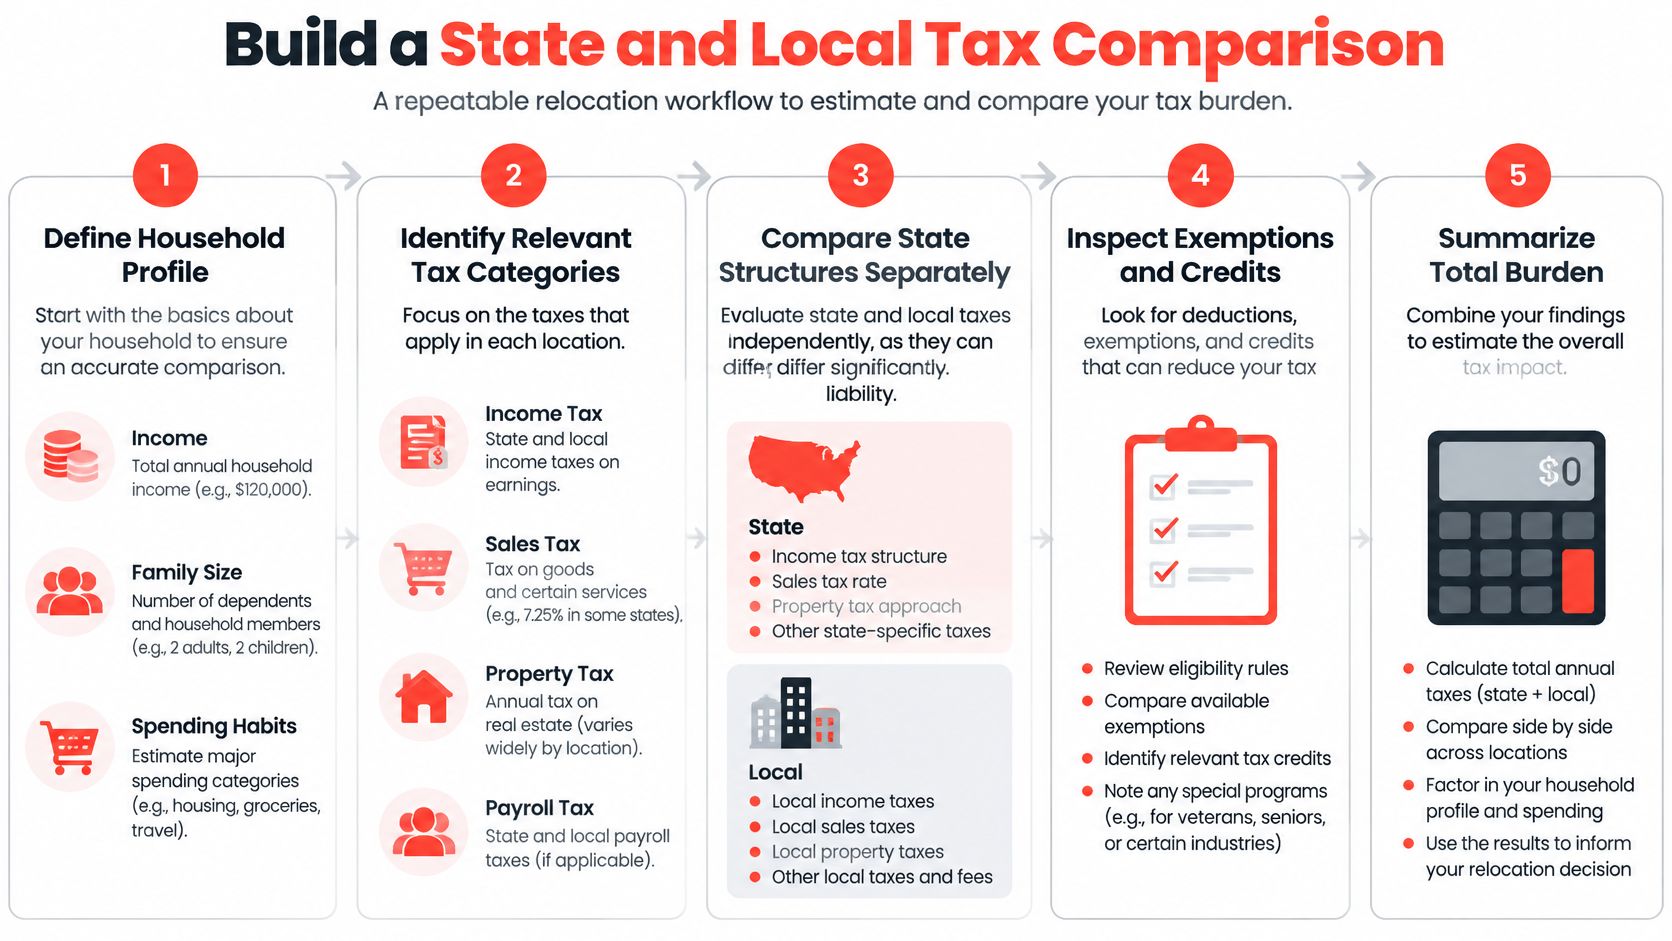
Create a comparison worksheet before ranking destinations. Use a consistent annual period and income definition, and distinguish verified amounts from estimates awaiting jurisdiction-specific confirmation.
Build the worksheet around decisions
- Define the household: Carry forward your earnings, housing, spending, and employment assumptions.
- Separate state and local exposure: Record the applicable state rules independently from county, municipal, and other relevant local rules.
- Calculate comparable amounts: Estimate direct taxes by category before expressing the total relative to income.
- Track timing and uncertainty: Note payment dates, assessment sensitivity, and assumptions that could change.
- Record benefits and services: Distinguish cash offsets from public services that affect your broader relocation decision.
The workflow below provides a compact checklist.
Treat migration as context, not a verdict
Among states below the national-average state-and-local tax burden, 18 recorded net inbound interstate migration in fiscal year 2024. Among the 25 states and Washington, D.C., at or above average, 17 recorded net outbound migration, according to the Tax Foundation migration analysis.
That relationship doesn't prove taxes caused the moves. It doesn't tell you whether your employment prospects, housing requirements, or preferred services match those of the people who moved.
A destination should pass your household calculation before its migration trend influences your decision.
Use low-tax city comparisons to generate candidates, then verify current deductions, exemptions, assessment rules, and benefit eligibility. Confirm which tax jurisdictions apply to the actual address rather than assuming a city label resolves every boundary.
Finally, examine liquidity separately from annual totals. A manageable yearly estimate can still require planning when payments concentrate at particular dates or when property assessments change without a corresponding increase in household cash income.
Use ReloMaps Indicators in Location Research
ReloMaps is one screening option alongside official tax-agency guidance, local assessment records, and household-specific calculations. It consolidates city and neighborhood context, category grades, and filters rather than managing property listings or agent leads.
Start with Austin, Texas as an example of a city-first research process, not as a claim that it offers the lowest burden. Review the available tax-burden indicator alongside housing and economic measures, then compare candidate destinations using the same definitions.
The city page provides the location context illustrated below.

Use indicators to identify tradeoffs
A tax grade is most useful when paired with the household priorities that could change your destination choice:
- Housing and affluence: Compare home values, rents, homeownership, and economic context without treating an average as your expected expenditure.
- Work patterns: Review commute times and work-from-home rates, then test your actual workplace requirements.
- Safety and hazards: Consider crime and safety indicators, natural-hazard exposure, and proximity factors separately from taxation.
- Lifestyle and services: Assess whether civic conditions and local amenities fit your household's needs.
The interactive city exploration tools allow you to narrow candidates across these dimensions. The combined ReloScore and category grades support screening, but they don't establish eligibility for a tax exemption or calculate a property-specific assessment.
Don't omit the benefits side
For households in the lowest income quintile, a 2021 Congressional Budget Office analysis found that means-tested transfers plus federal taxes increased average income by $26,200, or 116%, to $48,700, as detailed in CBO's household-income distribution report.
That finding doesn't predict benefits after a move. It shows why a taxes-only comparison can omit a material part of household resources, particularly when eligibility differs between scenarios.
For each shortlisted destination, preserve a distinction between the platform's location indicators and your verified tax worksheet. Check the indicator's geography and period, then confirm the exact state, county, municipality, property, and household rules through the responsible authorities.
A practical decision rule is to evaluate effective household burden, payment timing, uncertainty, relevant benefits, and non-tax fit together. Weight those factors according to your needs before signing a lease, buying property, accepting a job, or selecting a retirement destination.
The cheapest state on an aggregate ranking isn't necessarily your cheapest workable destination. A city-level shortlist becomes useful when you can explain both the estimated financial difference and the tradeoffs you're willing to accept.
Frequently Asked Questions
How do I compare states when one taxes income and another relies on purchases?
Use the same income and spending assumptions in both calculations. Build a taxable-purchase basket rather than applying a sales-tax rate to your entire budget, and verify the treatment of each substantial spending category.
For a move during the year, also check each state's residency and part-year filing guidance. Don't assume the date you change your mailing address settles every tax obligation.
Can moving to a state without broad individual income tax create transition costs?
Yes, relocation-related transactions can create costs that don't appear in a recurring annual estimate. Ask the relevant authorities whether vehicle registration, title changes, property transactions, or other move-related activities involve taxes or fees.
Keep these in a separate transition budget. That prevents a one-time charge from distorting your estimate of ongoing affordability.
Why might an employee owe tax despite having no state income-tax withholding?
Withholding is a payment mechanism, not a determination of final tax liability. If you live and work in different jurisdictions, verify the rules for work location, residency, credits, and any applicable agreements.
Remote and hybrid employees should give payroll their actual working arrangement. Ask which locations payroll used and reconcile that treatment with current official guidance before relying on take-home pay.
How should a buyer or renter investigate property-tax exposure at an address?
Use address-specific records and rules rather than treating assessed value as the tax bill. Buyers should request the current bill, confirm available exemptions, and ask whether the existing owner's treatment would apply after purchase.
Renters should examine the lease for any tax-related adjustment provisions rather than assuming a landlord's entire bill passes directly through. For either household, verify the relevant county, municipal, and other taxing jurisdictions.
ReloMaps brings tax-burden indicators together with housing, safety, commute, and hazard context for residential research. Visit ReloMaps to build a city shortlist, then apply the same household assumptions and jurisdiction-specific checks to each destination before committing to a move.
Enjoying the blog? Subscribe to ReloMaps+ for premium area intelligence — and to keep us independent.
Subscribe today