Tax Rate Comparison by State: What Movers Need to Know

A state's headline income-tax rate doesn't determine your actual tax bill; the full mix of income, sales, property, and local taxes, weighted to your spending and assets, matters more. Nationwide, the average state-local tax burden was 11.2% of state income in fiscal year 2022, a more useful starting benchmark than an income-tax rate alone.
The popular advice to move somewhere without an income tax skips the household calculation. A family buying an expensive home and a family renting modestly can earn the same income yet reach opposite relocation decisions. A useful tax rate comparison by state starts with the tax system, then translates it into the life you expect to live.
Table of Contents
- Why Headline Tax Rates Mislead Movers
- Understanding Tax Burden Versus Tax Rates
- State-by-State Comparison of Major Tax Types
- Effective Tax Burden Scenarios for Different Households
- How Tax Differences Should Shape Your Relocation Decision
- Practical Steps for Comparing Taxes Across States
- Frequently Asked Questions
Why Headline Tax Rates Mislead Movers
No individual income tax isn't the same as a low household tax bill. States can collect revenue through sales, property, severance, excise, and other taxes. Removing one line from your budget doesn't tell you what remains on the others.
The nationwide benchmark above also conceals substantial variation. Alaska's state-local burden was 4.6% of state income and $2,943 per person, while some high-burden states exceeded 12% and $11,000 per resident, according to the Tax Foundation's 2025 handbook reporting fiscal year 2022 burdens. These are historical statewide benchmarks, not estimates of what a particular mover owes today.
Start with the household question
The useful question isn't which state charges less. It's which tax structure costs less for your income, housing choice, and purchases.
| Comparison lens | What it tells you | What it leaves unresolved |
|---|---|---|
| Advertised income-tax rate | The legal rate for a particular income-tax base | Deductions, brackets, local taxes, and other tax types |
| Combined sales-tax rate | The percentage relevant to taxable purchases | Your actual taxable spending |
| Statewide property-tax benchmark | Broad property-tax exposure | The bill on your chosen home |
| Overall state-local burden | The wider fiscal environment | Your household's position within that environment |
A household that directs more of its budget toward taxable purchases needs a different comparison from one that saves heavily. Likewise, a buyer concentrating wealth in a home needs to investigate property taxes more closely than someone planning to rent.
Practical rule: Treat a low-tax ranking as a shortlist tool, not permission to skip the household budget.
Separate the destination from the tax label
A state-level comparison can help eliminate poor fits, but the final decision involves a specific community and housing arrangement. Don't compare a statewide average on one side with a particular neighborhood's costs on the other.
My analytical starting point is to hold the household constant while changing locations. Only after that comparison should you change the housing size, ownership plan, or spending assumptions. Otherwise, you can mistake a lifestyle change for a tax advantage.
Understanding Tax Burden Versus Tax Rates
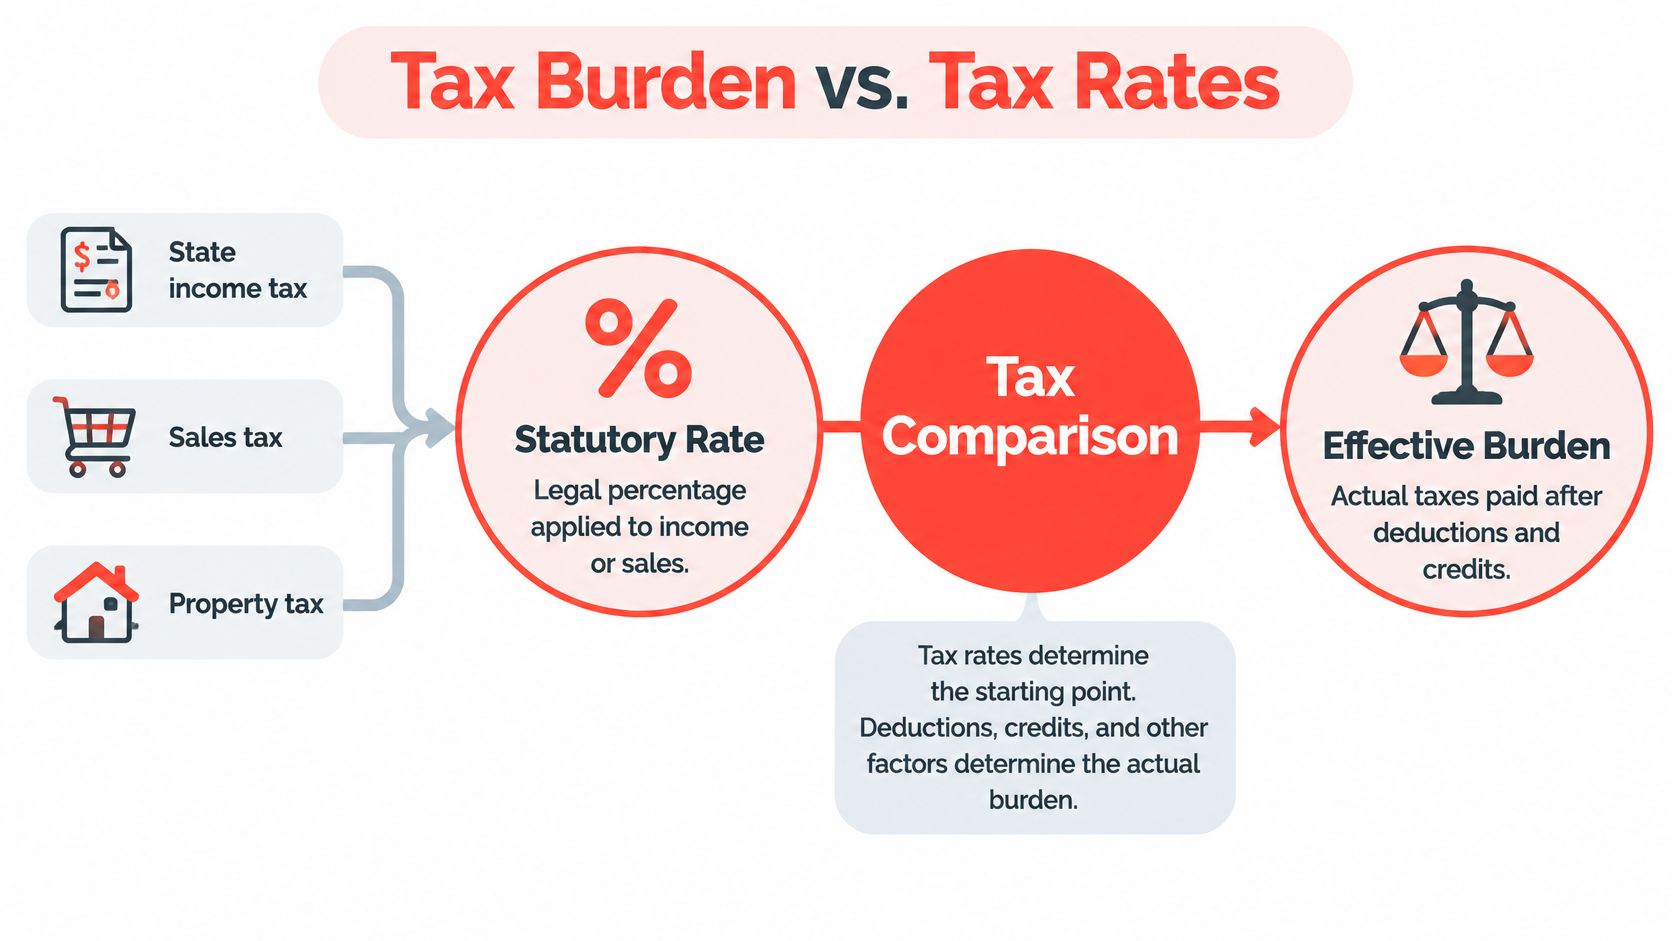
Statutory rates, aggregate burdens, and household effective rates answer different questions. Confusing them produces precise-looking comparisons that don't measure the same thing.
A statutory rate is the legal percentage applied to a defined tax base. A household effective rate expresses its estimated tax payments relative to income. An aggregate burden describes a broader population and shouldn't be substituted directly for your personal effective rate.
The relationship is easier to follow when the tax base and adjustments remain visible.
Match the numerator and denominator
Before comparing percentages, identify exactly what each measures. A sales-tax percentage applies to taxable consumption, while a property-tax burden expressed against personal income measures something entirely different.
- Income-tax estimate: Apply the relevant filing rules to taxable income, rather than multiplying gross earnings by the highest bracket.
- Consumption estimate: Identify taxable purchases before applying the applicable combined rate.
- Property estimate: Use the property's assessment and applicable local rules to estimate its bill.
- Household effective burden: Combine comparable annual amounts and divide by the same household-income measure.
The important discipline is consistency. If one destination estimate includes local taxes and another excludes them, the difference isn't a reliable savings estimate.
Distinguish collections from personal liability
The Census Bureau's historical state-tax collection files provide a different perspective: actual government revenue by state and tax type. Census has collected state-government tax revenue annually since 1939; its historical files extend from 1951 to the present, with detailed annual online data available from 1992 onward.
Those records help identify changes in the revenue mix over time. They don't replace a household calculation, and state-government collections alone don't capture every local levy a mover may encounter.
Business owners also need to keep business taxation separate from personal relocation costs. For a Florida-specific starting resource, Bookkeeping and Accounting of Florida Inc.’s guide to 2026 Florida business tax rates can support that separate review. Don't assume a favorable personal-tax label answers questions about a company's obligations.
A useful comparison preserves the distinction between what governments collect, what the law charges, and what your household would pay.
State-by-State Comparison of Major Tax Types
Different tax types require different comparison methods. The snapshot below deliberately identifies the measurement basis rather than presenting unlike percentages as interchangeable.
State Tax Comparison Snapshot
| State | Income Tax | Sales Tax | Effective Property Tax |
|---|---|---|---|
| Alaska | No individual income tax | No statewide sales tax | Check the intended property locally |
| Tennessee | No individual income tax | 9.61% combined average | 1.74% of personal income |
| New Hampshire | No individual income tax | No statewide sales tax | 4.64% of personal income |
| Alabama | Graduated individual schedule | 9.46% combined average | 1.40% of personal income |
| Washington | Review the applicable income category | 9.57% combined average | Check the intended property locally |
| Maine | Model the applicable household schedule | Verify the purchase jurisdiction | 5.09% of personal income |
| Vermont | Model the applicable household schedule | Verify the purchase jurisdiction | 5.13% of personal income |
The table combines 2026 income-tax classifications, the cited 2026 sales-tax comparison, and 2025 property-tax benchmarks. Sources are the 2026 State Tax Competitiveness Index, state and local sales-tax comparison, and 2025 property-tax burden comparison, respectively.
Income and corporate taxes
The income-tax classifications also identify Florida and Texas as states without individual income taxes, while South Dakota and Wyoming impose neither individual nor corporate income tax. That distinction matters if your move involves both a household and a business.
For historical rate context, the individual income-tax tables as of January 2025 list Hawaii's top individual rate at 9.00%, Montana's flat rate at 4.70%, and Utah's flat rate at 4.55%. Those are dated comparison points, not interchangeable estimates of current liability.
The same tables report local income taxes in jurisdictions across Alabama, Indiana, Iowa, Kentucky, Maryland, Michigan, Missouri, New York, Ohio, and Pennsylvania. Reported average effective local rates range from 0.09% in Alabama and Iowa to 2.51% in Maryland, with New York at 1.68% and Pennsylvania at 1.07%.
Sales and property taxes
The sales-tax comparison identifies Alaska, Delaware, Montana, New Hampshire, and Oregon as having no statewide sales tax. It places California's state-level rate at 7.25%, Colorado's lowest nonzero state rate at 2.9%, and the population-weighted combined average at 7.53%. Louisiana's combined average reaches 10.13% in that comparison.
The property figures use collections divided by personal income, not tax divided by home value. Other listed benchmarks include New Jersey at 4.81%, New York at 4.44%, Connecticut at 4.07%, Arkansas at 1.67%, Oklahoma at 1.77%, and Louisiana at 1.86%.
Don't multiply those income-based property percentages by a home's purchase price. For a Maine shortlist, Maine state tax help from Omni offers a jurisdiction-specific resource for further review. Use the lowest-tax cities comparison to narrow locations, then investigate the actual properties.
Effective Tax Burden Scenarios for Different Households
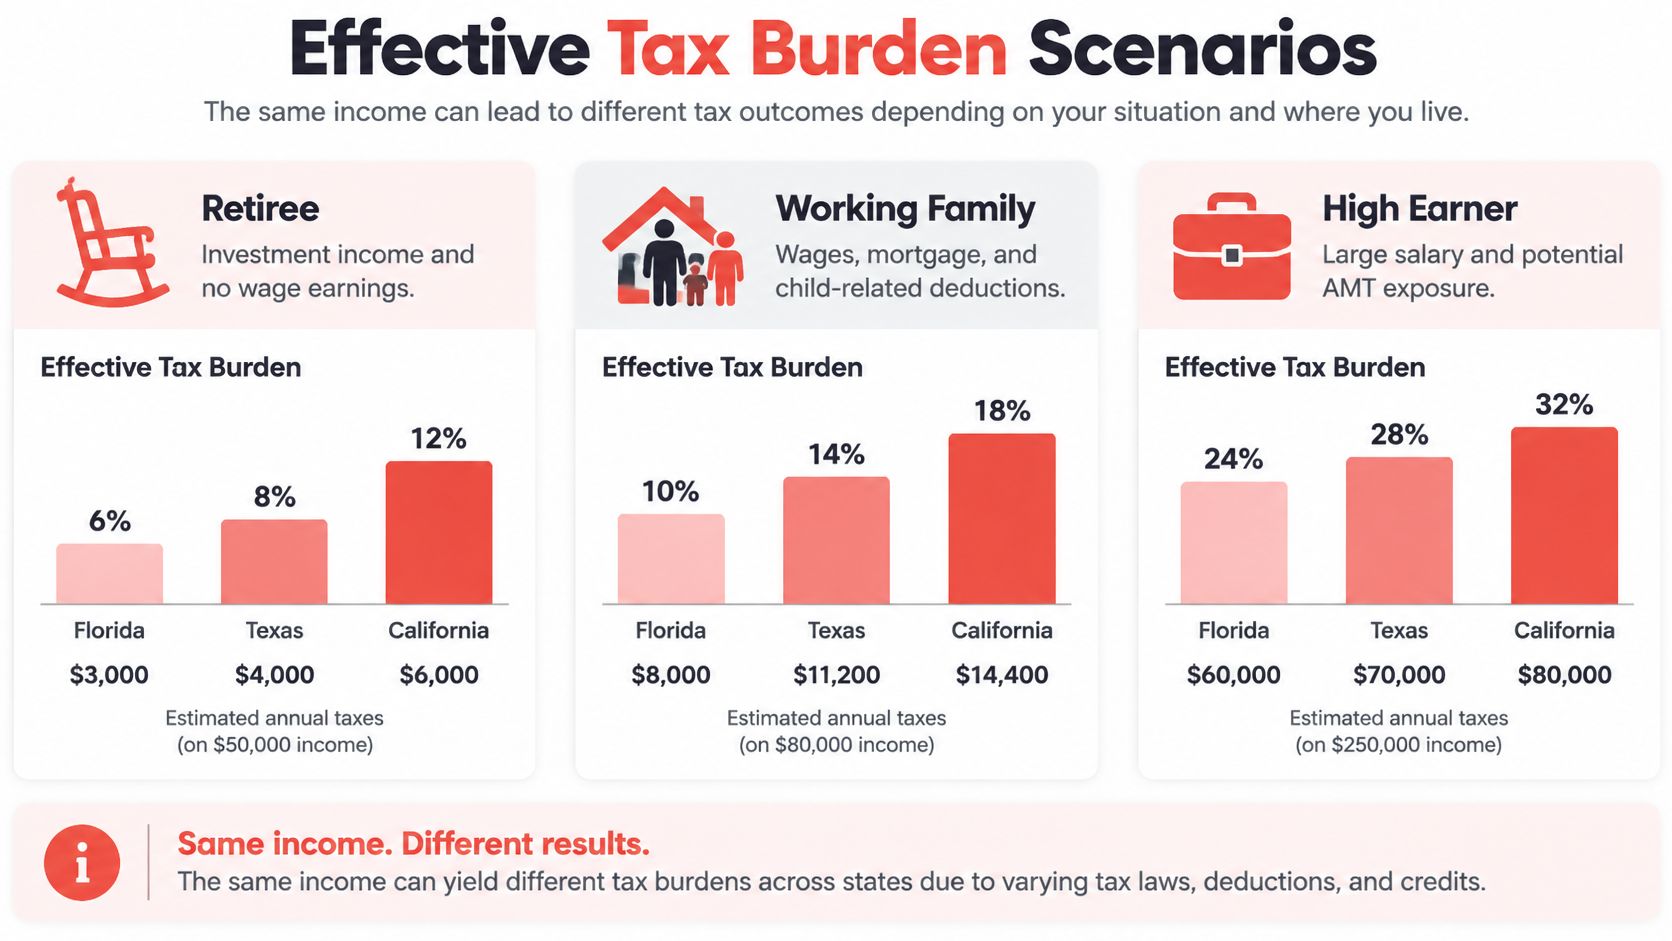
The scenarios below are analytical household profiles, not reported case studies or calculated savings claims. Their purpose is to identify which inputs could reverse a relocation ranking.
Different households need different weighting across the same tax categories.
A homebuyer and a renter with equal income
Consider a family planning to buy an expensive home and another family planning to rent while saving for a later purchase. Hold their income constant, but don't hold their tax exposure constant.
For the buyer, the decisive missing input is the estimated annual property-tax bill on the intended home. For the renter, a more useful immediate calculation may be taxable purchases and any applicable income taxes. Neither family should use the other's result.
This distinction supports the household-specific approach discussed in KTVU's coverage of state tax comparisons: housing exposure, consumption, income, and local jurisdiction can change which tax structure is cheaper.
- Homebuying family: Obtain the expected assessment, applicable exemptions, and local bill estimate before treating a statewide property benchmark as favorable.
- Renting household: Model consumption directly and keep rent in the housing budget, rather than inserting a homeowner's property-tax bill into personal taxes.
- Large-purchase household: Separate recurring spending from planned vehicles, furnishings, or other taxable purchases so moving-year costs don't masquerade as permanent expenses.
A retiree and a high earner
A retiree relying on investments needs to classify income before evaluating a destination. A wage-focused comparison may not capture the questions that matter to that household. The retirement-location shortlist is useful for organizing candidate communities before checking their specific tax treatment.
A high earner should compare the complete bracket calculation with a flat-rate calculation. The historical rate examples above don't establish a winner because deductions, filing status, and the amount reaching each bracket remain unresolved.
The video offers another perspective to consider alongside a written household worksheet.
Local income taxes deserve a separate worksheet line, not a footnote. The jurisdictions identified earlier are a reminder to verify the actual municipality and relevant local rules before comparing take-home income.
Decision test: Change one assumption at a time. If changing the housing plan reverses the preferred destination, housing exposure is driving the result more than the state's advertised tax identity.
How Tax Differences Should Shape Your Relocation Decision
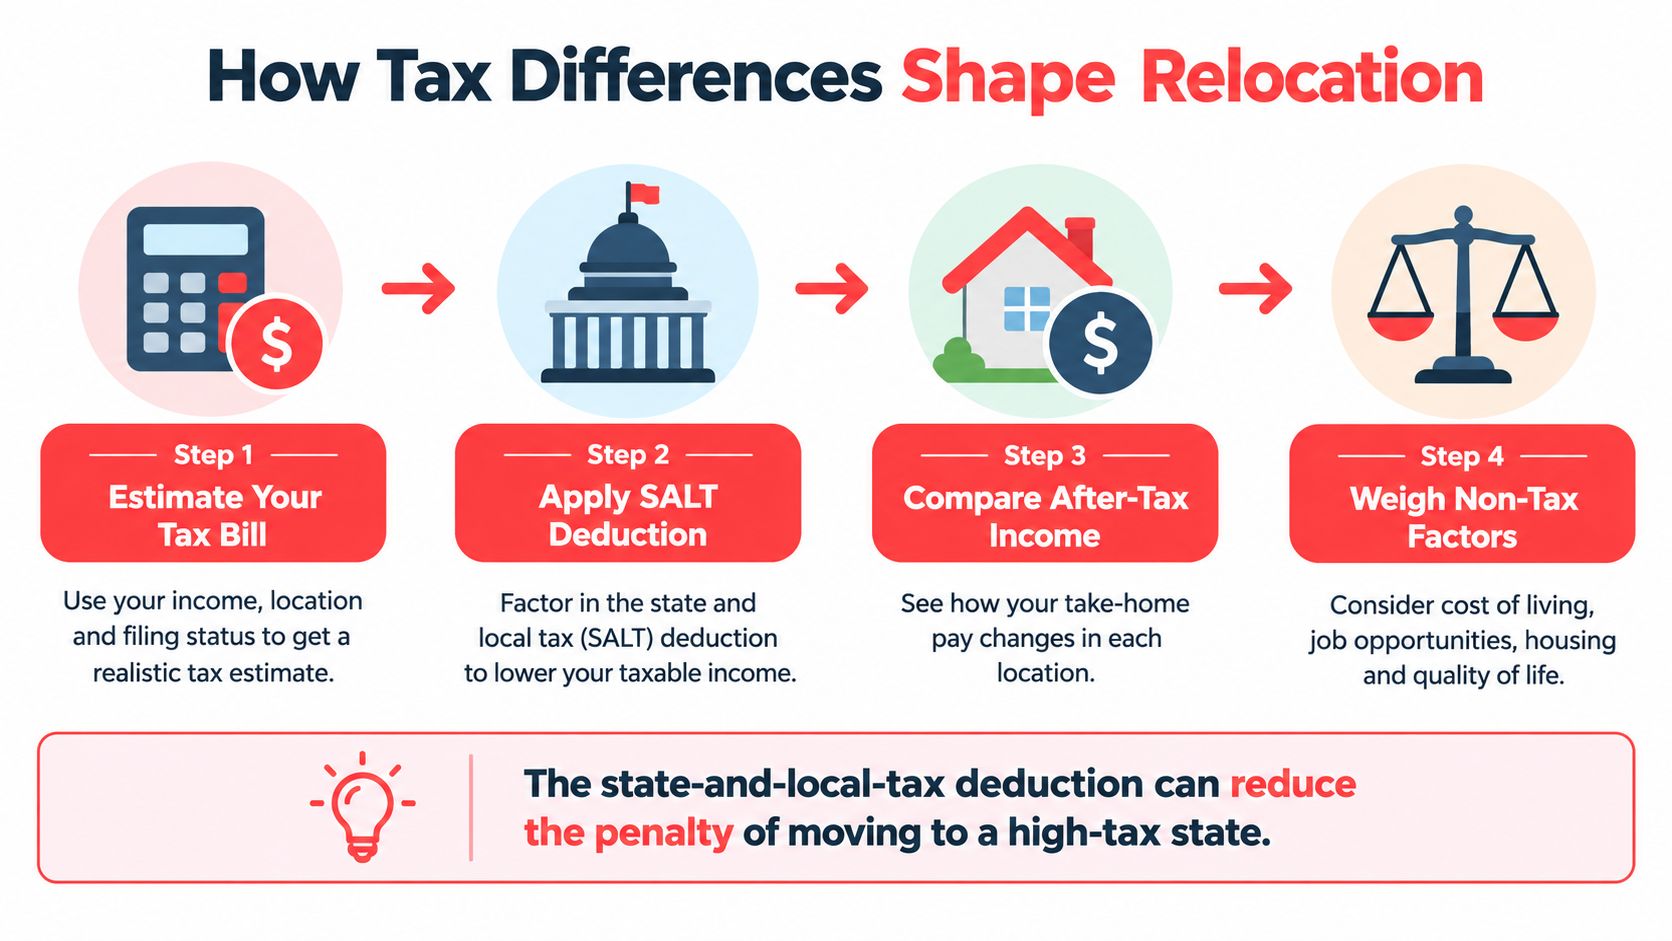
A relocation decision should compare after-tax household budgets, not just add up visible state taxes. Federal deductions and proposed reforms can change the result, but neither should be treated as guaranteed savings.
The sequence matters: estimate the household's state-local liability, evaluate the applicable federal treatment, then compare the remaining budget.
Calculate the federal offset separately
Under the cited 2026 SALT deduction rules explained by Jackson Hewitt, the cap is $40,400 for single filers, heads of household, and married couples filing jointly, and $20,200 for married couples filing separately. The cap begins phasing down at $505,000 in modified adjusted gross income and reaches the $10,000 floor at $606,333 or more.
The deduction matters only when the taxpayer itemizes and satisfies the applicable rules. A deduction also isn't a dollar-for-dollar reimbursement, so don't subtract the deductible amount directly from the destination's tax bill.
Keep a separate line for the estimated federal tax effect. That makes it possible to see whether the destination remains attractive without assuming the maximum available deduction produces the maximum personal benefit.
Evaluate reform as a replacement scenario
The Tax Foundation's property-tax replacement analysis estimated that replacing Florida's property-tax revenue solely through sales tax would require increasing the combined average sales-tax rate from 7.02% to 15.34%, before allowing for reduced taxable sales at the higher rate.
That's a reform scenario, not an enacted household bill. Its analytical value is that it forces the replacement-revenue question into the comparison.
- Current-law budget: Use the obligations applicable to the intended move.
- Reform budget: Identify who receives direct relief and which replacement taxes or service changes could affect the household.
- Timing assessment: Keep uncertain changes out of guaranteed savings.
The broader budget also needs housing, transportation, insurance, and other non-tax costs. ThriveXDNA's guide to how to weigh urban versus rural costs provides a complementary budgeting framework.
Use a cheapest-cities shortlist to identify candidates, not to override your own spending assumptions. A tax advantage is useful only if the complete destination budget works.
Practical Steps for Comparing Taxes Across States
Build the worksheet before naming a winner. Every figure in it should trace back to a source, a tax year, and an assumption you expect to hold.
| Worksheet input | Source | Tax year | Uncertainty |
|---|---|---|---|
| Income by category (wages, retirement, investment) | Your own records | Year of the planned move | Expected income changes |
| Income tax after deductions and exemptions | State revenue department tables | Rules for the filing year | Filing-status changes |
| Property tax on the intended home | County assessor record for the address | Most recent assessment | Reassessment after purchase |
| Sales tax on typical taxable spending | State and local rate schedules | Current combined rate | Local rate revisions |
Keep the candidate home and the surrounding community visible while you work.

Assemble the inputs
Work through the worksheet in order:
- Define the household. Record filing status, dependents, income categories, ownership plans, and expected taxable spending.
- Choose specific destinations. Compare actual communities rather than treating every address within a state as equivalent.
- Collect applicable rules. Save the tax year, effective date, jurisdiction, and source beside each worksheet input.
- Split property tax into its components. Give the assessment ratio and the millage rate separate columns, because two towns with identical millage can bill identical homes differently once the ratio differs.
- Separate recurring and moving costs. Keep one-time purchases out of the ongoing annual comparison.
For a Texas candidate, start with the housing and community context in Austin, Texas, then obtain the relevant tax information for the intended address. City-level context and property-level verification serve different purposes.
Calculate and stress-test the result
Estimate income taxes after the applicable deductions and exemptions. Add local taxes, taxable-purchase costs, and the intended property's estimated bill, then evaluate any federal offset separately.
Model at least two income paths you expect, such as buying after two years of renting or a shift from wages to investment income, and record which destination each path favors. A ranking that survives both paths deserves more confidence than one built on a single snapshot.
Keep the results sheet compact: each major tax type visible rather than a single combined total, housing and destination costs listed separately from taxes, uncertainty notes flagging unverified assessments and unresolved local rules, and a written condition stating what would have to change for the runner-up to win.
Say the finished sheet shows Austin at $14,200 in annual state and local tax against Raleigh at $13,100. That gap means little until the assumptions column shows the Austin figure rests on a $520,000 purchase while the Raleigh figure assumes renting at $1,900 per month. Change either input and the ranking can flip. Two households earning identical salaries can reach opposite, equally correct answers, and the worksheet is what reveals why.
Frequently Asked Questions
Can filing status change a comparison even when gross income stays the same?
Yes, filing status and dependents can change taxable income and the effective bill. The 2026 Alabama income-tax tables list rates from 2% to 5%, standard deductions of $3,000 for single filers and $8,500 for married couples, and personal exemptions of $1,500 per single filer, $3,000 per couple, and $1,000 per dependent. Run the destination calculation again if your filing circumstances change.
Should a retiree use a wage-earner tax calculator?
Only if it separately handles the retiree's actual income categories. Enter investment and other retirement income according to the applicable state rules rather than relabeling everything as wages. Before relying on the output, check whether the calculator exposes those inputs or assumes employment income.
Can I deduct state income taxes and state sales taxes together?
No, the cited SALT rules require choosing state income taxes or state sales taxes for that component. As noted in the federal deduction discussion, eligible property taxes can also be relevant. Compare the permitted alternatives rather than adding both consumption and income taxes to the deductible total.
Would property-tax elimination automatically lower my rent?
No, a renter shouldn't budget an automatic rent reduction. The replacement scenario discussed earlier doesn't establish what a landlord would charge afterward. Evaluate the lease separately, and include any proposed replacement consumption taxes in your own spending calculation rather than assuming a homeowner's direct relief reaches you unchanged.
ReloMaps offers city and neighborhood comparisons covering cost of living, home values, safety, and other relocation factors alongside tax-burden context. Visit ReloMaps to shortlist communities, then pair that location research with a household tax worksheet and address-specific verification before committing to a move.
Enjoying the blog? Subscribe to ReloMaps+ for premium area intelligence — and to keep us independent.
Subscribe today