7 Safest Cities in Mississippi for 2026
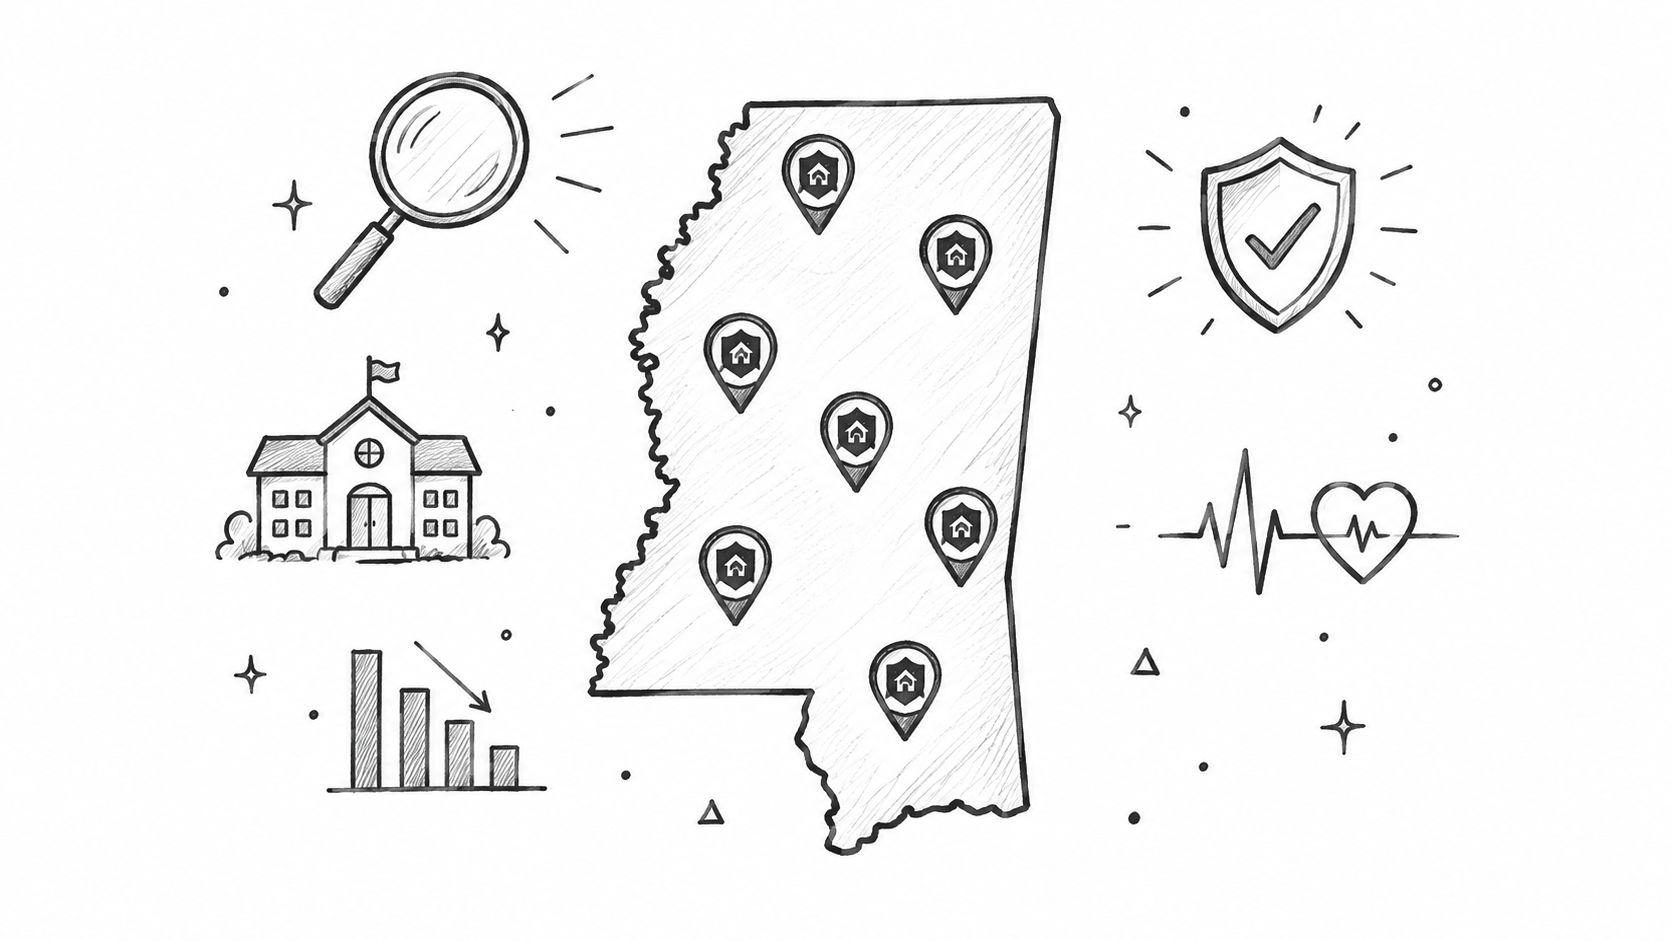
The seven cities covered here are Brandon, Madison, Ridgeland, Gulfport, Hattiesburg, Oxford, and Tupelo. Madison is the strongest reported safety anchor, with 57 violent crimes and 388 property crimes per 100,000 residents, but the ordering changes depending on source coverage and whether a comparison uses raw crime rates, modeled grades, or broader local context.
That distinction matters because “safe” can describe several different things. A low violent-crime rate may coexist with higher burglary or theft exposure, while a favorable resident grade may reflect schools, neighborhood cohesion, and daily comfort rather than a standardized crime calculation. Mississippi's statewide violent-crime rate is reported at 2.36 incidents per 1,000 people, below the national average of 4.43, according to SafeWise's Mississippi safety research.
The list below treats safety grades as shortlist signals, not guarantees. It compares reported violent and property crime, FBI reporting coverage, third-party scoring, resident sentiment, neighborhood variation, commuting context, schools, housing, and disaster exposure. For city-level crime, quality-of-life, and risk context, ReloMaps' Mississippi location intelligence provides a useful second layer before you inspect a specific address.
Table of Contents
- 1. Best Places to Live in Brandon, MS
- 2. SafeWise
- 3. Niche
- 4. AreaVibes
- 5. NeighborhoodScout
- 6. FBI Crime Data Explorer (NIBRS)
- 7. CrimeGrade.org
- Mississippi Safest Cities: 7-Source Comparison
- Turn a Statewide Ranking Into a Safer Move
- Frequently Asked Questions
- Can incomplete crime reporting make a Mississippi city look safer than it is?
- Is a safe Mississippi city safe across every neighborhood?
- What should I do when CrimeGrade, Niche, and FBI data disagree?
- What relocation costs can a safety ranking hide?
- Can hybrid workers ignore commute context when choosing among safe cities?
- When should I reject a city despite a strong safety score?
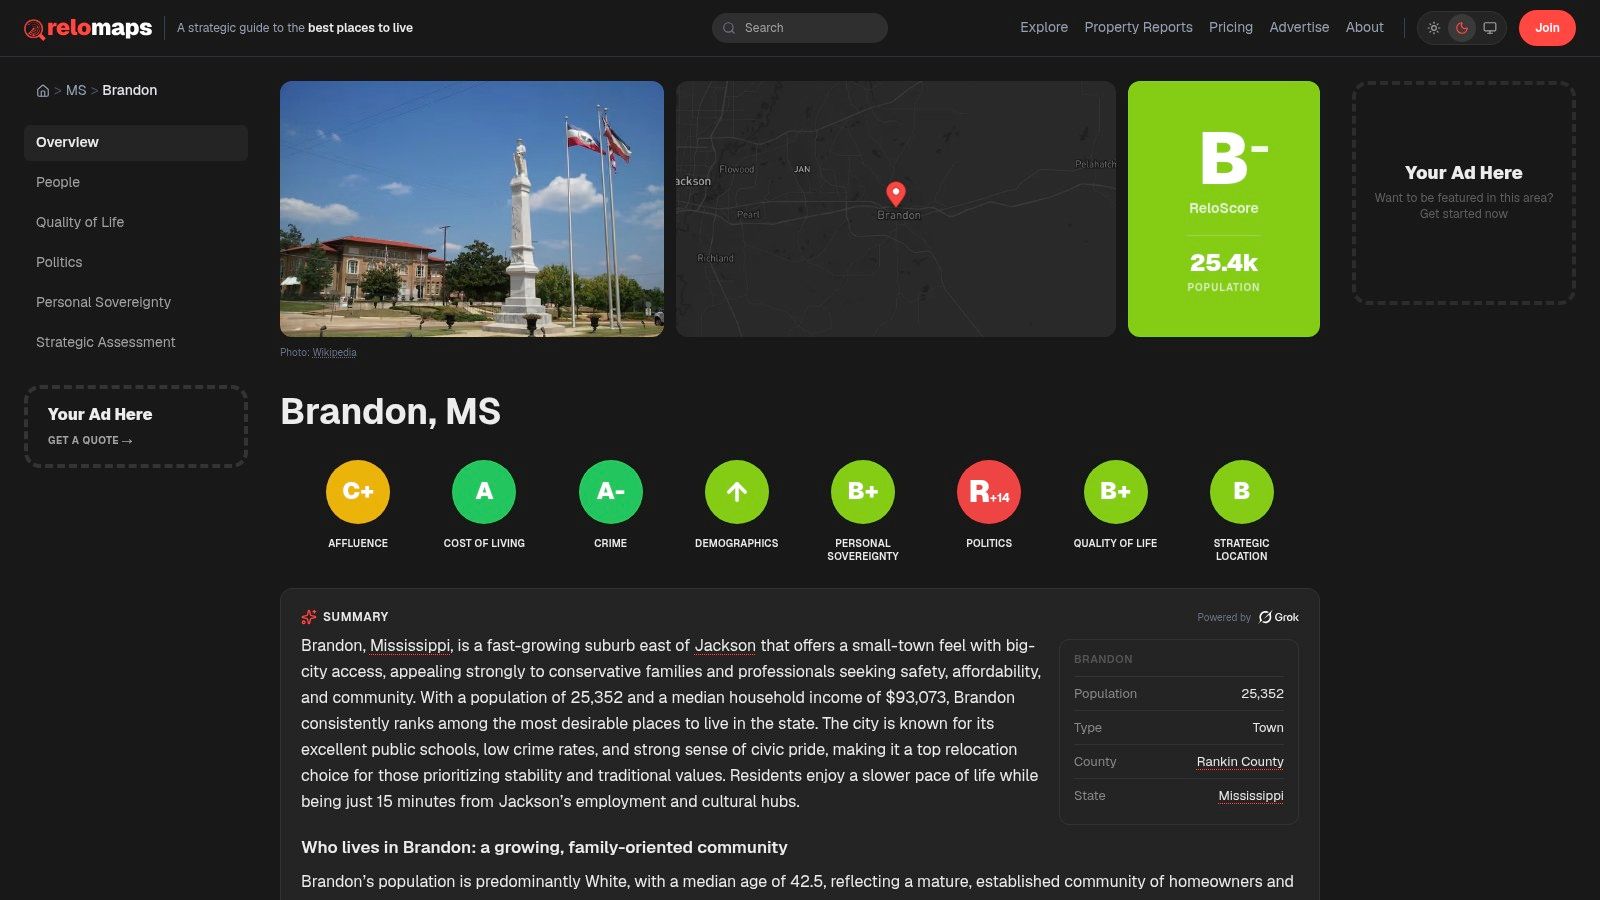
1. Best Places to Live in Brandon, MS
Brandon earns the strongest all-around position after Madison because its safety case isn't based only on low violent crime. A regional report citing SafeHome placed Brandon first in Mississippi for lowest property crime at 342 property crimes per 100,000 residents, while another statewide table recorded 49.9 violent crimes and 463 total crimes per 100,000. Those figures come from different methodologies, but both point toward the same practical conclusion, Brandon is a serious choice for households that care about everyday theft and burglary exposure as much as violent incidents. See the regional Brandon safety reporting for the underlying comparison.
Brandon also illustrates why buyers shouldn't treat one annual ranking as definitive. A separate dataset reported 88.8 violent crimes and 374.4 property crimes per 100,000 residents, with a population of 25,905. The gap between those figures isn't necessarily a contradiction. It reflects differences in reporting periods, source construction, and calculation methods.
Practical rule: If Brandon is on your shortlist, compare property crime first, then examine the exact neighborhood, parking arrangement, lighting, and routes you'll use after dark.
Why Brandon works as a relocation benchmark
Brandon is especially useful for a multi-factor relocation screen because a buyer may need more than a citywide crime label. The Brandon, Mississippi profile on ReloMaps brings safety, schools, cost of living, housing context, disaster exposure, airport proximity, and lifestyle indicators into one comparable view. Its ReloScore and A+ to F category grades can help reveal whether a strong safety result is offset by another household concern.
Interactive maps and filters are more useful than a single grade when you're comparing neighborhoods. A Zillow or Redfin listing can also be checked for surrounding context, including nearby risks and local characteristics. That doesn't turn ReloMaps into a listing service, MLS replacement, or agent-matching platform. It gives an active buyer a way to investigate the place behind the listing.
The trade-off
Brandon's profile can simplify research, but score-driven summaries may lag behind hyperlocal changes. A home visit, conversations with residents, and an agency-level crime check still matter. The city is best viewed as a high-confidence shortlist candidate, not an absolute guarantee for every subdivision or street.
2. SafeWise
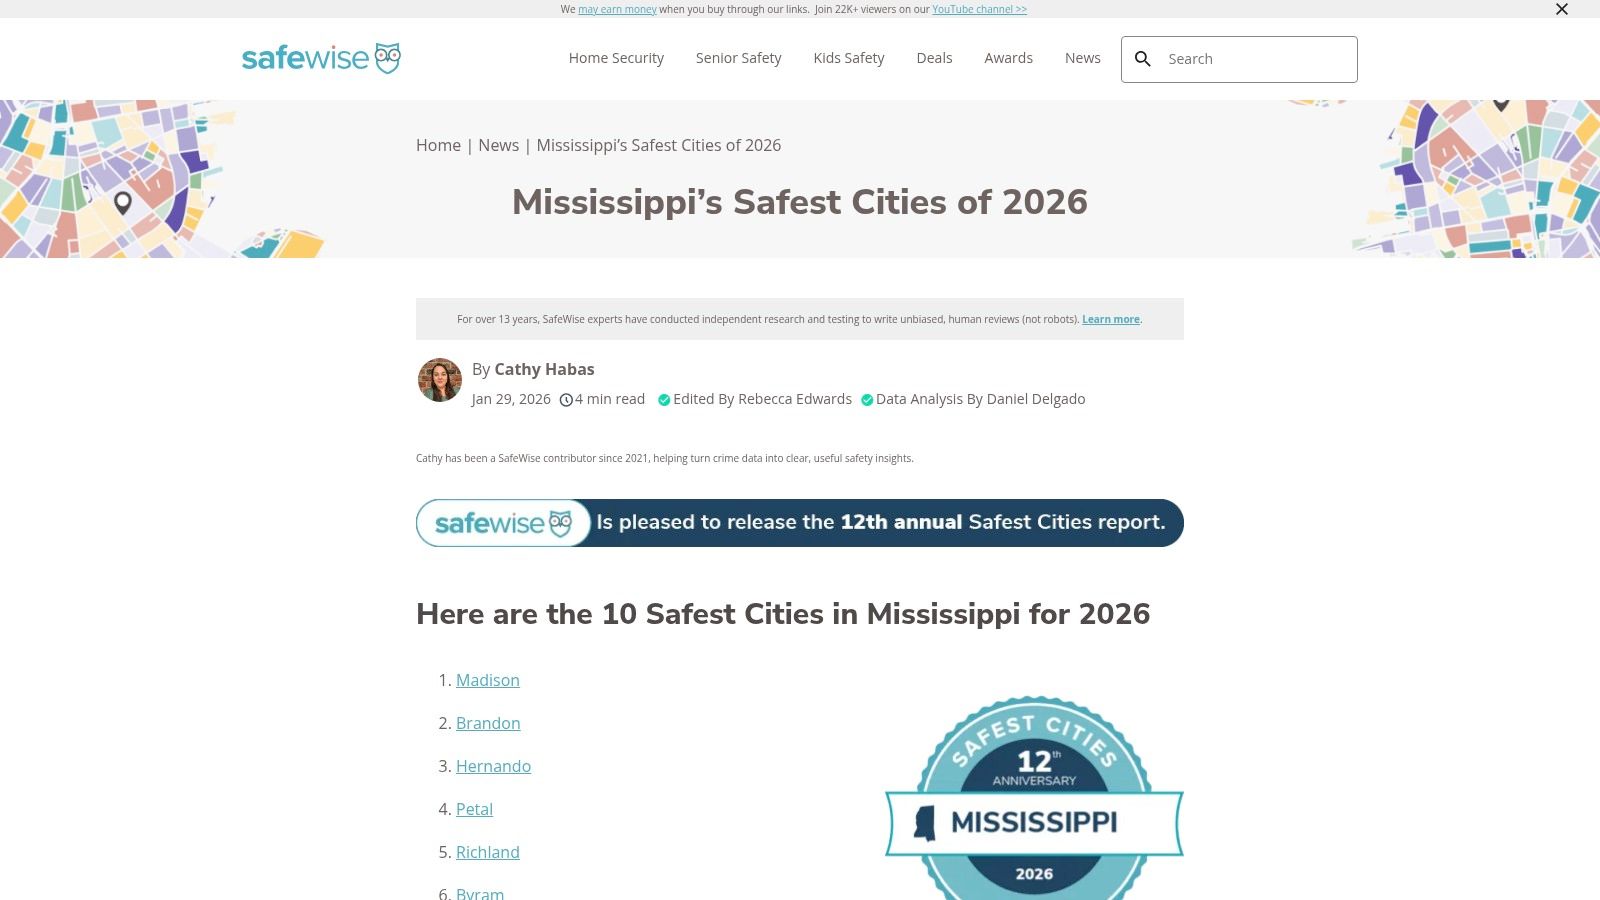
SafeWise offers a practical first screen for Mississippi because its ranking centers on recent FBI-reported violent and property crime, adjusted for population. Its current list places Madison, Brandon, and Hernando among the leading cities and explains how reporting completeness affects inclusion. That methodology makes the ranking more useful than a bare city list, while still limiting what the results can establish.
Its scope is narrower than a relocation assessment. SafeWise compares reported crime rates, but it does not grade commute fit, housing affordability, schools, political alignment, disaster exposure, or conditions within a specific subdivision. A high position can therefore identify a promising candidate without confirming that it suits a particular household.
The year and category must stay attached to every comparison. In its SafeWise's 2026 Mississippi ranking, SafeWise reports Mississippi's property crime rate rising from 18.2 to 21.35 incidents per 1,000 people year over year. Comparisons with earlier statewide periods may show a different direction for violent and property crime, so a broad claim that Mississippi is becoming safer or less safe would oversimplify the evidence.
Best use for the seven-city shortlist
Use SafeWise to establish an initial screen for Madison and Brandon, then investigate why Ridgeland, Gulfport, Hattiesburg, Oxford, or Tupelo receives a different result elsewhere. The ReloMaps safest-cities exploration tool can extend that comparison to broader relocation factors, including commuting context and disaster exposure.
Limitation
SafeWise depends on agency-reported data. Smaller municipalities or places with incomplete reporting may not appear, so treat a missing city as unresolved, not automatically unsafe. Before comparing cities, confirm that the relevant agencies reported consistently. A SafeWise grade supports a shortlist, not a guarantee for every street or neighborhood.
3. Niche
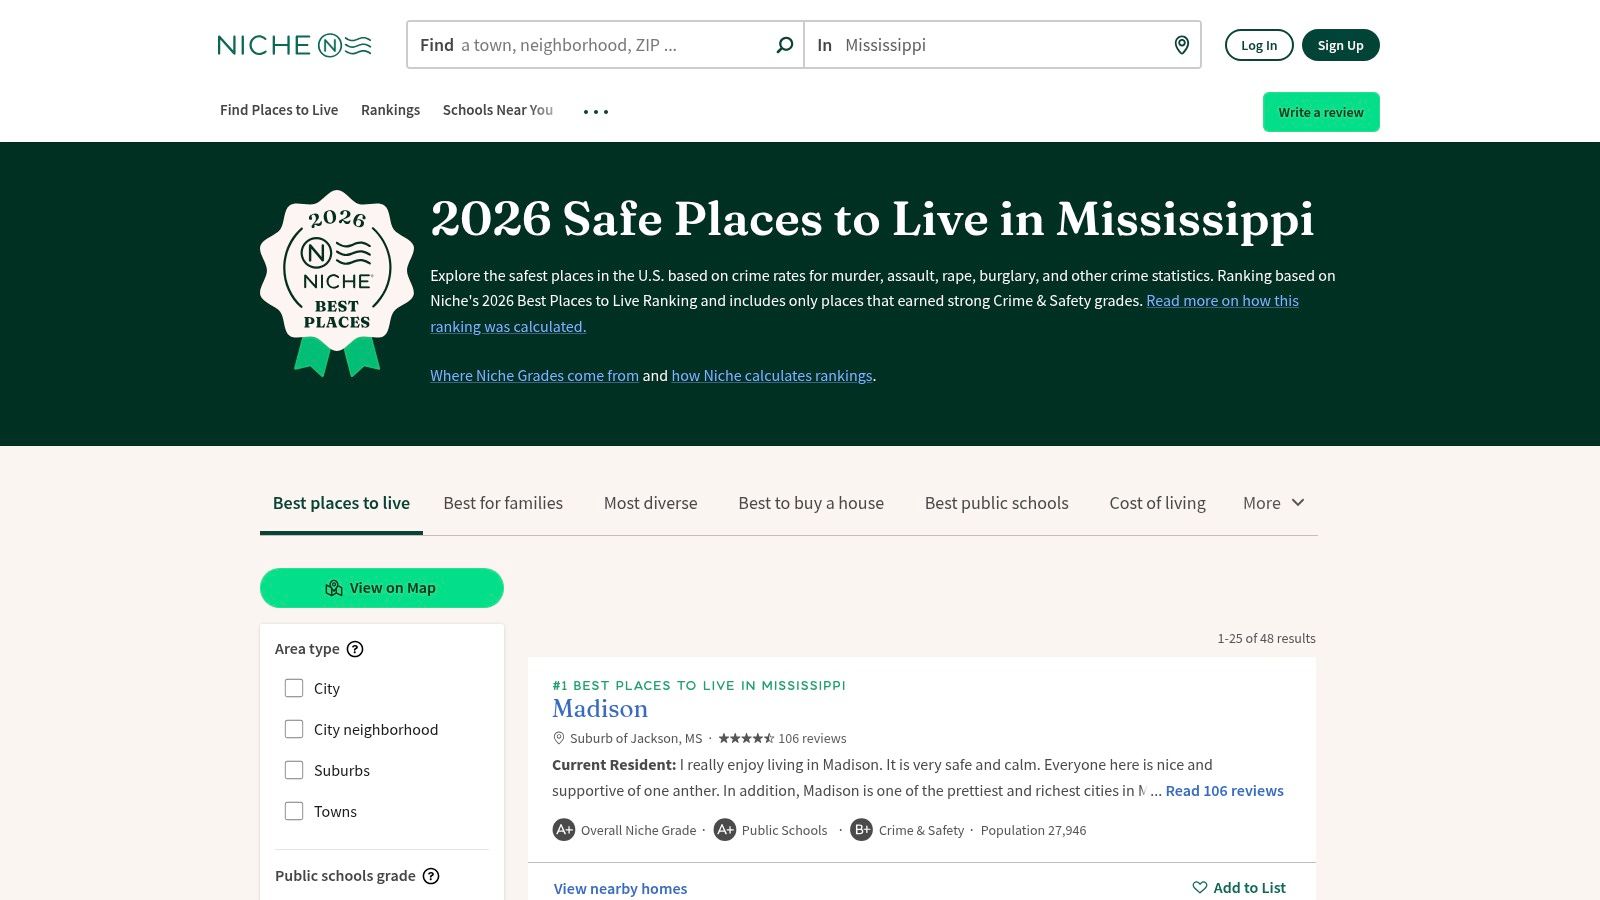
Niche's 2026 safest places in Mississippi answers a different question from a raw-rate ranking. Its Crime & Safety framework combines crime information with resident reviews and broader place-quality signals, including schools and cost of living. That makes it particularly relevant to families who use “safe” to mean both lower reported crime and a comfortable daily environment.
The benefit is context. A parent comparing Madison, Brandon, Ridgeland, Hattiesburg, Oxford, and Tupelo may care about school impressions, housing trade-offs, and whether residents describe the area as comfortable for walking, raising children, or returning home late. Niche makes those dimensions easier to review alongside a city's safety grade.
The cost is methodological mixing. Survey sentiment isn't the same as an offense rate, and resident reviews can be unevenly distributed across communities. A favorable grade may reflect lived experience, while an FBI-style figure reflects incidents recorded by an agency. Neither one should replace the other.
How to read the grade
Use Niche when your shortlist includes a family or lifestyle decision, not only a crime-screening decision. Look for agreement between the Crime & Safety grade, school information, resident sentiment, and the practical conditions around the neighborhoods you're considering.
Don't convert a positive review into a guarantee. Reviews may describe one apartment complex, campus area, subdivision, or period of time. For the seven-city comparison, Niche is best treated as a livability and perception layer that can explain why residents may feel differently about cities with similar reported crime profiles.
4. AreaVibes
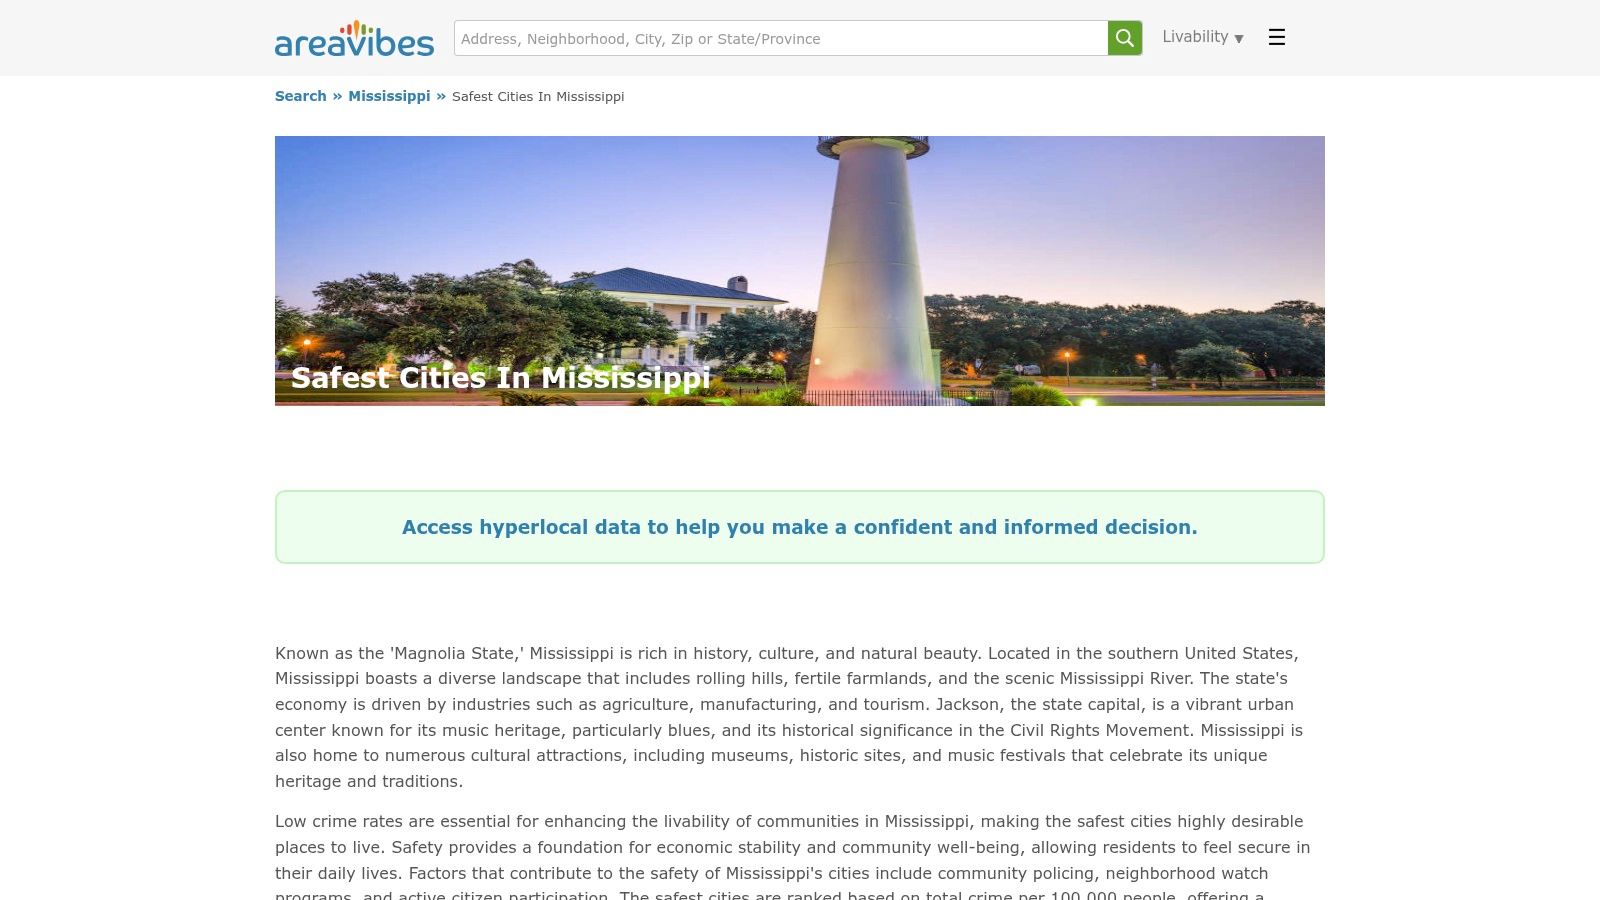
AreaVibes' Mississippi safety comparison is useful when you want fast, comparable city snapshots. It presents violent, property, and total crime rates alongside safety gauges and a broader livability framework. That combination helps prevent a common relocation mistake, choosing a city because its violent-crime headline looks good while overlooking property crime, housing, amenities, or cost pressures.
The statewide comparison identifies Madison with 57 violent crimes and 388 property crimes per 100,000 residents, producing a combined total of 445 crimes per 100,000, which the source describes as about 72% below the Mississippi average. The same comparison places Brandon, Petal, Hernando, Byram, and Long Beach in the next tier of safer municipalities. Madison's position is therefore not just an editorial preference. It is supported by a clear all-category result in this dataset.
Why the dashboard helps
AreaVibes makes it easier to place the seven target cities into a consistent visual framework. You can use the same categories for Madison, Brandon, Ridgeland, Gulfport, Hattiesburg, Oxford, and Tupelo instead of relying on different descriptions from different articles. That consistency is valuable when a move involves several competing regions.
The livability layer also exposes trade-offs that crime-only sites omit. A city may look attractive on safety but less suitable for a buyer who needs a particular commute, school environment, housing profile, or amenity mix.
Limitation
AreaVibes' visual grades and livability scores can feel opaque if you want to reproduce every calculation. Its results also depend on the latest available FBI release and the completeness of local agency reporting. Use the dashboard for side-by-side screening, then verify unusual results through a primary-data source and neighborhood research.
5. NeighborhoodScout
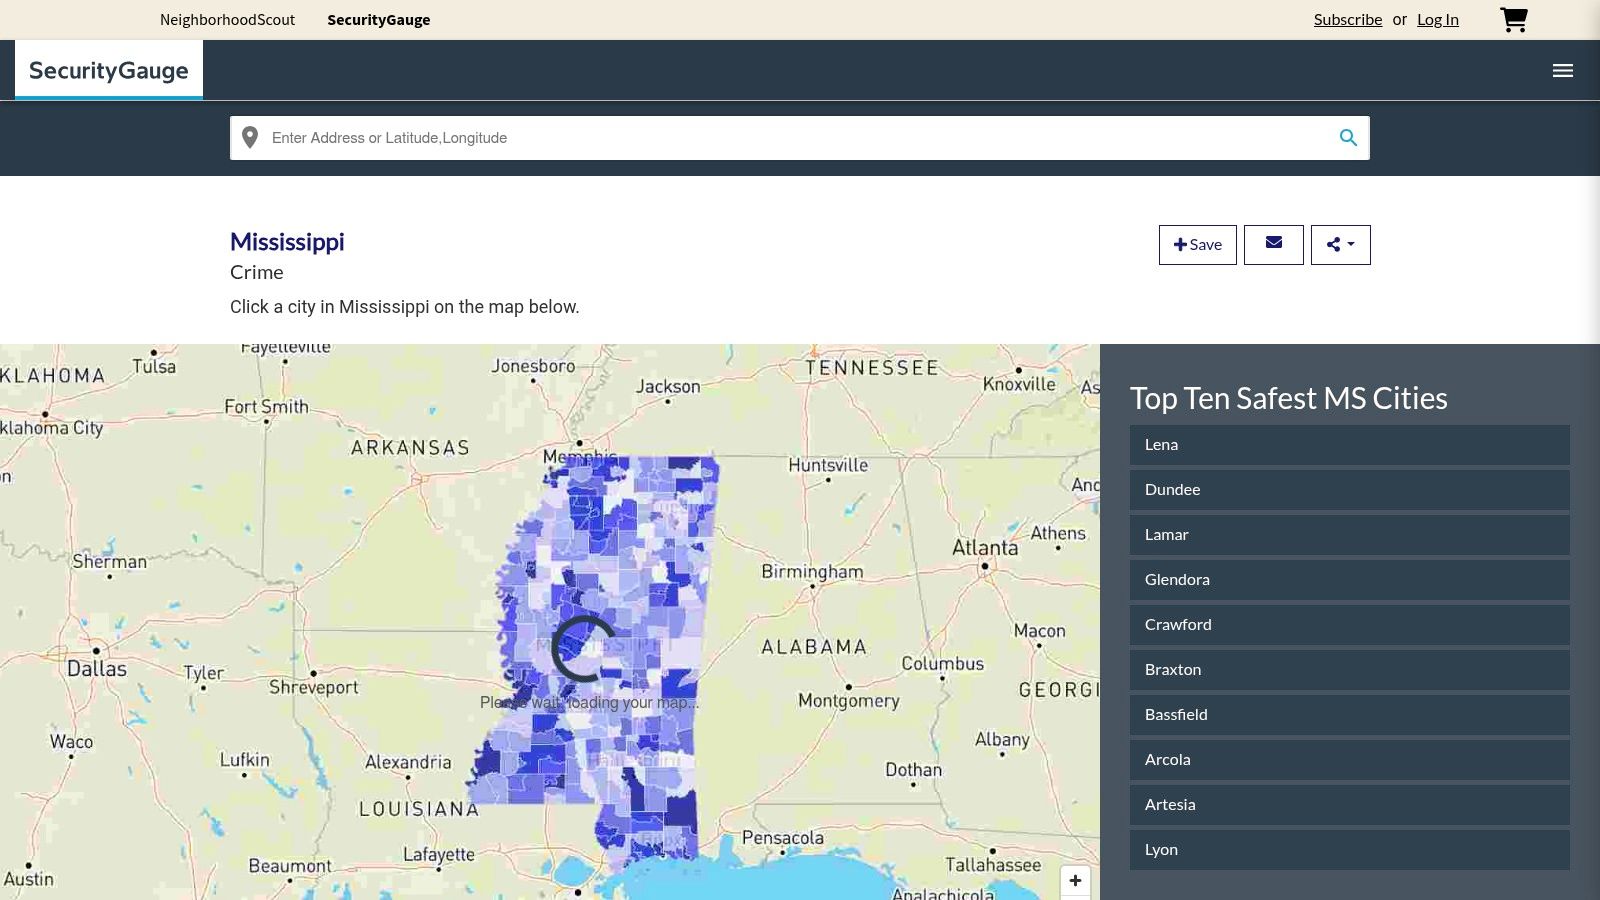
NeighborhoodScout's Mississippi security data is the strongest choice in this list when the decision has reached the address stage. It offers city and neighborhood crime maps, heat maps, per-1,000 rates, and a normalized Crime Index that runs from 0 to 100, with higher values indicating greater safety. Those features shift the question from “Which city ranks highest?” to “How does this part of the city compare with nearby areas?”
That distinction matters because citywide averages can conceal meaningful variation. A buyer may compare a neighborhood near a commercial corridor with one farther from major activity, or assess whether a proposed home sits near a boundary between reporting areas. A state listicle usually cannot resolve those questions.
Where the model fits
NeighborhoodScout is most useful after you have narrowed the seven-city list. Use it to inspect candidate neighborhoods in Brandon or Madison, then compare equivalent areas in Ridgeland, Gulfport, Hattiesburg, Oxford, or Tupelo. Consistent metrics are helpful when the cities use different local contexts and when raw statewide rankings don't explain the neighborhood pattern.
A citywide safety grade should start the search. A neighborhood-level pattern should influence the address decision.
The platform's proprietary modeling won't always match raw FBI summaries. That doesn't make one automatically wrong. A modeled index may normalize or weight offenses differently, while a raw table reports what an agency recorded. Detailed reports may also sit behind a paywall, so budget for the possibility that the most useful address-level analysis requires additional access.
Limitation
Don't use a NeighborhoodScout index as a substitute for visiting the area. Check lighting, vacant properties, access points, traffic patterns, and the route between home, work, school, and essential services. The model narrows uncertainty, but it can't observe every block condition on the day you tour.
6. FBI Crime Data Explorer (NIBRS)
The FBI Crime Data Explorer is the strongest verification point in this seven-city comparison because it exposes the reporting behind a safety result. Users can query Mississippi by agency, offense category, and year, then review definitions, tables, and coverage periods. That agency-level view can reveal why two polished city grades are not directly comparable.
NIBRS coverage deserves particular attention. Before comparing rates, check whether each relevant agency reported for the same period and whether the record is complete. A missing value signals limited evidence, not a low crime rate. Separating violent and property offenses also prevents two different risks from being compressed into one score.
A practical verification sequence
Use the same year and categories for all seven cities. Identify the reporting agency, confirm its coverage, and record gaps before interpreting the results. If the records do not support a clean comparison, preserve that uncertainty rather than forcing a rank.
The FBI Crime Data Explorer map view can support geographic review, but reported crime is only one part of a relocation decision. It does not assess commuting practicality, school fit, or exposure to flood, tornado, hurricane, and other hazards. Pair the findings with ReloMaps' Mississippi relocation data when judging broader fit.
Limitation
The interface takes practice, and some Mississippi agencies may not report for every year. That constraint should remain visible in the analysis. For screening people who may enter a property or organization, review sex-offender registries separately, since registries address a different question from citywide crime reporting.
7. CrimeGrade.org
CrimeGrade.org's Mississippi safety map offers the quickest visual scan of the state. Its color-coded maps and A to F grades cover violent crime, property crime, and overall safety, while its methodology explains that offense severity affects the weighting. That makes the tool intuitive for a household that wants to spot areas for closer research before opening detailed data tables.
CrimeGrade is particularly useful as a second opinion. If Madison, Brandon, Ridgeland, Gulfport, Hattiesburg, Oxford, or Tupelo receives a result that differs sharply from an FBI-based list, the disagreement creates a research prompt. Check whether the difference comes from offense weighting, modeled data, geographic boundaries, or sparse agency reporting.
How to use visual grades responsibly
An A grade isn't a promise that every street has the same risk. A lower grade isn't proof that an entire city should be rejected. Use the map to identify neighborhood variation, then compare the result with raw category data and a visit to the exact area.
CrimeGrade also broadens coverage to smaller places and neighborhood-level views, which can help when a statewide list excludes a community. Its weakness is the same feature that makes it easy to use: a letter compresses several decisions into one symbol. Readers who need an auditable comparison should keep the violent and property grades separate rather than relying only on the overall result.
Mississippi Safest Cities: 7-Source Comparison
| Item | Implementation complexity | Resource requirements | Expected outcomes | Ideal use cases | Key advantages |
|---|---|---|---|---|---|
| Best Places to Live in Brandon, MS (ReloMaps) | Low, interactive web profile, easy to navigate | Free web access; listing-URL parsing optional | Consolidated ReloScore, A–F category grades, interactive maps, disaster & policy signals | Relocation shortlisting and neighborhood context for Brandon | Combines safety, schools, cost, civic indicators and actionable listing-context tools |
| SafeWise | Very low, simple ranked list and summaries | Free, editorial aggregation of FBI data | Statewide ranked list with plain-English city summaries and methodology notes | Quick citation or initial shortlist of safest MS cities | Timely, easy-to-scan state-specific rankings with clear explanations |
| Niche | Low, ranked pages with grades and reviews | Free access; relies on resident surveys plus FBI data | Crime & Safety grades combined with resident reviews, schools, livability context | Balancing objective crime metrics with resident sentiment and school info | Blends quantitative data with qualitative reviews and broad community coverage |
| AreaVibes | Low, dashboard-style city pages and gauges | Free access; uses recent FBI releases | Comparable city snapshots with violent/property rates and visual safety gauges | Fast side-by-side city comparisons and quick statistic checks | Consistent, easy-to-compare visuals and broad coverage of small/mid-size cities |
| NeighborhoodScout | Medium, detailed maps and indices, some learning curve | Freemium; granular reports often behind paywall | Neighborhood heat maps, per-1,000 rates, 0–100 Crime Index | Block- or neighborhood-level screening before relocating or buying | Highly granular, consistent metrics useful for fine-scale comparisons |
| FBI Crime Data Explorer (NIBRS) | High, technical query interface, steeper learning curve | Free primary-source data; requires data literacy to analyze | Agency- and offense-level tables, downloadable raw data, reporting completeness | Authoritative verification, research, tailored offense-specific analyses | Primary official source with transparent definitions and downloadable data |
| CrimeGrade.org | Very low, visual maps and A–F grades | Free web access; uses weighted offense models | State and neighborhood maps, letter grades by category and overall | Quick visual statewide scans or second-opinion checks | Intuitive visuals and simple grades suited for nontechnical audiences |
Turn a Statewide Ranking Into a Safer Move
The clearest statewide shortlist signal is Madison, followed by Brandon. Madison appears consistently near the top of independent comparisons, and historical reporting shows its violent-crime rate staying near 0.4 to 0.5 incidents per 1,000 residents across 2024 to 2026, which supports stability rather than a one-year spike. Brandon earns a similarly strong position because multiple sources keep placing it near the top while highlighting relatively low property-crime exposure.
The remaining five cities, Ridgeland, Gulfport, Hattiesburg, Oxford, and Tupelo, should be treated as context-dependent finalists, not automatically safer or less safe based on name recognition. Their final position depends on reporting completeness, neighborhood variation, property crime, commute patterns, schools, housing, and hazard exposure. A city with a favorable modeled grade may still be a poor fit if the commute is exhausting, the chosen neighborhood has different conditions, or the household's disaster-risk tolerance is low.
Use this sequence before making an offer:
- Match the categories: Compare violent crime with violent crime and property crime with property crime, using the same year and rate basis.
- Check reporting coverage: Confirm that the relevant agency reported completely and that a missing value hasn't been mistaken for a low rate.
- Inspect the neighborhood: Use a granular map, review nearby land uses and routes, and visit at different times.
- Test daily movement: Drive the commute, school run, shopping route, and airport route you will use.
- Review relocation fit: Compare schools, housing costs, work-from-home needs, hazard exposure, and household priorities alongside crime.
- Recheck the address: A strong citywide result can't certify a specific street, apartment complex, or subdivision.
ReloMaps can consolidate these city and neighborhood factors into comparable grades, filters, risk context, and property-linked research. The FBI Crime Data Explorer remains the right place to challenge a third-party ranking and inspect agency-level reporting. Use both, but don't let either one make the decision for you.
Frequently Asked Questions
Can incomplete crime reporting make a Mississippi city look safer than it is?
Yes, incomplete reporting can make a city's apparent safety impossible to interpret confidently. Treat missing agency coverage as an unresolved risk rather than filling the gap with statewide averages. Before comparing finalists, require the same reporting period, confirm that violent and property categories are both available, and downgrade confidence when the agency's coverage is partial.
Is a safe Mississippi city safe across every neighborhood?
No, citywide results don't guarantee uniform neighborhood conditions. Screen the exact address for nearby commercial activity, vacant buildings, major roads, lighting, access points, and the route to work or school. A city should remain on your list only when its neighborhood-level evidence supports the specific housing area you can realistically afford.
What should I do when CrimeGrade, Niche, and FBI data disagree?
Use the FBI data to verify reported offenses, then treat Niche as resident sentiment and CrimeGrade as a modeled, weighted visual comparison. Don't average the grades together. Instead, identify the source of disagreement, such as reporting coverage, offense weighting, geographic boundaries, or a difference between violent and property crime.
What relocation costs can a safety ranking hide?
A safety ranking can hide the cost of choosing a neighborhood that requires longer daily driving, additional security measures, flood or storm preparation, or a different school arrangement. Price the full routine before committing, including commuting fuel, insurance implications, home security, school transportation, and the cost of visiting the area repeatedly during due diligence.
Can hybrid workers ignore commute context when choosing among safe cities?
No, hybrid workers should test both the occasional office trip and regular essential routes. A home that looks attractive on a safety map may become a poor fit if office days, airport access, medical appointments, school runs, or family visits create difficult travel patterns. Measure the actual route at the times you expect to drive, not only from a map's default estimate.
When should I reject a city despite a strong safety score?
Reject a city when it fails a mandatory household threshold, even if its safety score is excellent. Examples include unacceptable disaster exposure, inadequate school fit, an unworkable commute, unaffordable housing, poor access to essential services, or neighborhood-level evidence that conflicts with the citywide grade. Safety is a filter, not permission to ignore the rest of the move.
ReloMaps brings crime, neighborhood context, schools, housing, commuting, demographics, disaster exposure, and lifestyle factors into one relocation research view. Compare Madison, Brandon, Ridgeland, Gulfport, Hattiesburg, Oxford, and Tupelo against your household's actual safety thresholds by visiting ReloMaps before you choose a neighborhood.
Enjoying the blog? Subscribe to ReloMaps+ for premium area intelligence — and to keep us independent.
Subscribe today